The states with the highest (and lowest) stock market participation


Washington, D.C., has the highest rate of stock market participation in the U.S., with 29% of tax returns from there reporting dividend or capital gains income in 2022, the year for which the most recent Internal Revenue Service (IRS) data is available, according to a Motley Fool analysis of that data. The District of Columbia’s stock market participation rate is more than double that of Mississippi, which has the lowest in the country at 11%.
Stock market participation by state is calculated by measuring the share of tax returns reporting dividend or capital gains income in a given year. Retirement account income is not included. This methodology was first used by researchers at the Federal Reserve Bank of St. Louis in 2017. It is a conservative estimate of actual state-level stock market participation, not a full count of investors. A separate Gallup survey puts overall U.S. stock ownership at 58%, more than double what this measure shows, because most of that 58% invest through a retirement account.
For individual investors, the long-standing gap in stock market participation between states highlights unequal exposure to decades of stock market gains and provides further insight into the distribution of stock ownership and its implications for wealth distribution.
Washington, D.C., has the highest rate of stock market participation; Mississippi has the lowest
Nationally, 21% of tax returns reported dividend income and 19% reported capital gains in 2022. Washington, D.C. led with reported dividend income at 29% and capital gains at 25%, while Mississippi came in at the bottom at 11% and 10%, respectively
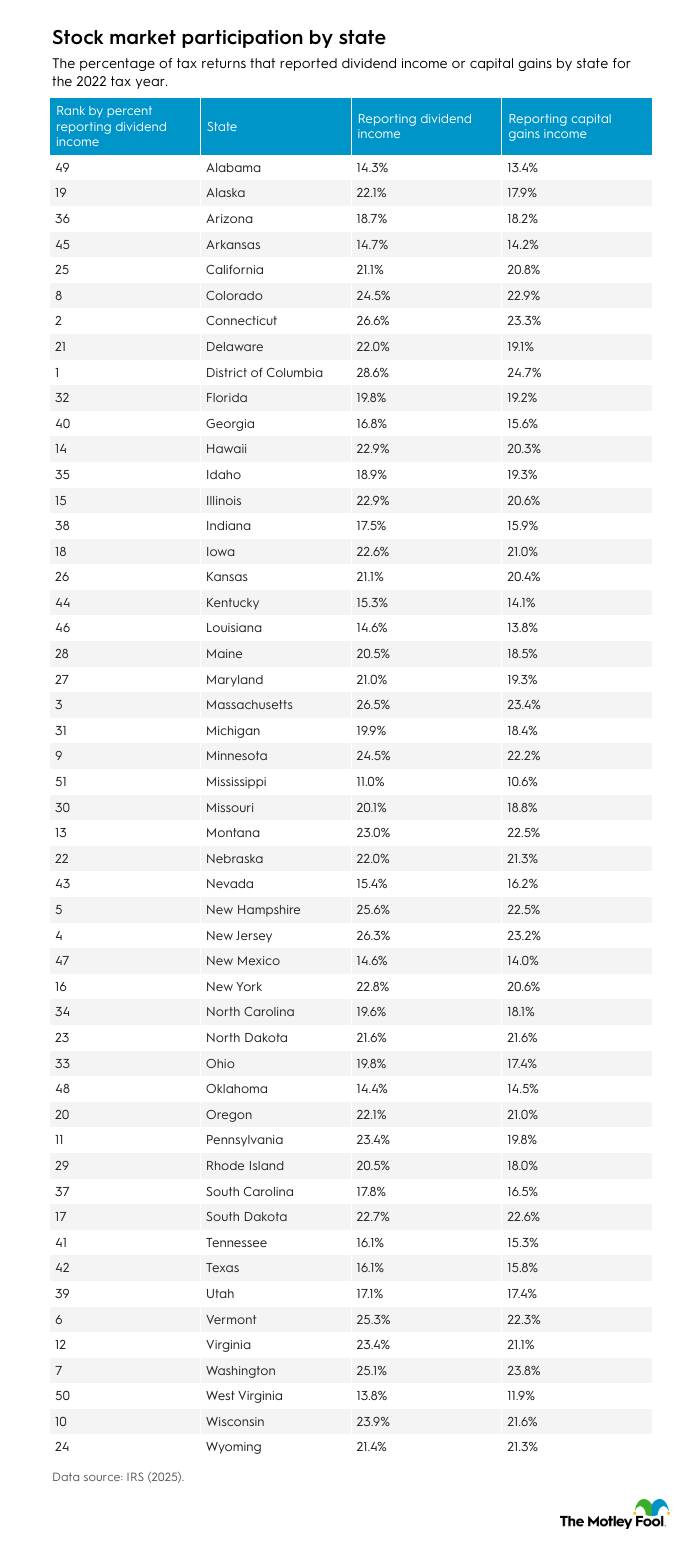
In addition to the District of Columbia, these states led in reporting dividend income: Connecticut (27%), Massachusetts (27%), New Jersey (26%), and New Hampshire (26%).
The states with the lowest percentage of their population reporting dividend income were Mississippi (11%), West Virginia (14%), Alabama (14%), Oklahoma (14%), and New Mexico (15%).
The states with the highest percentage of residents reporting capital gains income, after Washington, D.C., were Washington (24%), Massachusetts (23%), Connecticut (23%), New Jersey (23%), and Colorado (23%).
The states with the lowest share of residents reporting capital gains income were Mississippi (11%), West Virginia (12%), Alabama (13%), Louisiana (14%), and New Mexico (14%).
Median household income is a driver of differences in the rates at which states report stock market participation — higher income states have a higher share of residents reporting than lower income states. D.C.’s median household income is nearly double Mississippi’s, but its median age is five years lower.
Washington, D.C.’s stock market participation also grew faster than any state from 2013 to 2022, by 7%. Washington state’s grew by 4%, California by 3%, and Colorado by 3% as well. Overall, 48 out of 51 jurisdictions saw their stock market participation grow. Connecticut, Alaska, and West Virginia shrank by less than a percentage point.
The distinction between capital gains and dividends is important because they track different stock ownership events. Dividend income comes from stock, mutual fund, and REIT payouts, so it’s a fairly direct measure of stock ownership. Capital gains, as reported on a tax return, can come from selling any asset, including real estate or a business, not just stocks, so it’s a broader measure of income that may not be derived from selling a stock.
Median state income drives the stock ownership gap among states
Median household income accounts for 61% of the difference in stock market participation among states, based on a regression analysis of IRS tax returns and Census Bureau income data. States with higher median incomes tend to have higher stock market participation rates, while states with lower incomes tend to have lower participation rates.
The median age of a state’s population has nearly no relationship to stock market participation as measured in this article, despite older Americans owning a higher percentage of stocks than younger ones, according to Motley Fool research.
There are some exceptions:
- Utah has a median income of $104,000, the sixth highest in the nation and well above the national median household income of $83,730. But it’s ranked 39th in stock market participation as measured by reported dividend income.
- Maryland ranks third highest in household income but just 27th for stock market participation.
- Wisconsin and Pennsylvania outperform. They’re in the middle of median household income, at 27th and 34th, respectively, but are 10th and 12th for stock market participation.
A simple state-level comparison can’t explain why some states have higher or lower participation relative to their median incomes. Income is a dominant factor in stock market participation, but not the only one. Other potential explanations range from financial habits to differences in access to employer-sponsored retirement plans, regional financial literacy and more, none of which this data measures directly.
What gaps in state-level stock market participation reveal about stock ownership
State-level stock market participation shows investment gains in the form of a dividend or sale of an asset that qualifies for capital gains tax. It is not a full measure of stock ownership. Living in a low-participation state does not mean residents don’t own stock. Many likely do so through a retirement account such as a 401(k) or an IRA, which aren’t captured in this ranking.
By that narrower measure, the gap between states is wide and, in the case of Washington, D.C., has been growing for at least a decade.
That income is a primary driver of differences in stock market participation across states isn’t surprising, given that the top 1% by net worth own more stocks than the bottom 90%, according to a Motley Fool analysis of Federal Reserve data. Adding a geographic dimension highlights how widespread that concentration is, and reveals where on the ground the divide is starkest.
Closing the stock market participation gap doesn’t require picking the right individual stock or timing an investment. For many households, the first step can be contributing to a retirement account or a low-cost index fund; the same approach countless other investors have used to start their own investing journeys that work best for them.
FAQs
What state has the highest rate of stock market participation?
Washington, D.C., has the highest stock market participation rate in the country, with 29% of tax returns reporting dividend or capital gains income in 2022, according to IRS data. D.C. overtook Connecticut, the previous leader, in 2020.
What state has the lowest rate of stock market participation?
Mississippi has the lowest stock market participation rate of any state, at 11% in 2022. West Virginia, Alabama, Oklahoma, and New Mexico round out the bottom five.
Does stock market participation include money held in a 401(k) or IRA?
No, this measure of stock market participation is based on dividend and capital gains income reported on a tax return, and retirement accounts aren’t taxed or reported that way. That means it’s a conservative estimate of true investing activity, not a full count of investors.
Methodology
Stock market participation data comes from the IRS Statistics of Income Division’s Individual Income and Tax Data, by State, Tax Years 2013 through 2022. The data also includes returns from Washington, D.C. Participation is defined as the share of tax returns that report either dividend income or net capital gains, using the methodology first employed by YiLi Chien and Paul Morris of the Federal Reserve Bank of St. Louis in a 2017 analysis of 2014 data. The data set does not include dividends or capital gains earned from a 401(k), IRA, or other tax-deferred account. Because the data only captures dividends or asset sales, it is a conservative estimate of stock market participation, not a full count of individual investors by state.
Median household income figures are in 2024 real dollars, adjusted for inflation, from the Census Bureau’s Current Population Survey Annual Social and Economic Supplement. Median age by state is calculated from the Census Bureau’s 2025 Population Estimates. The income and age comparisons in this analysis are simple state-level linear comparisons and should not be used to establish causation.
This story was produced by The Motley Fool and reviewed and distributed by Stacker.
