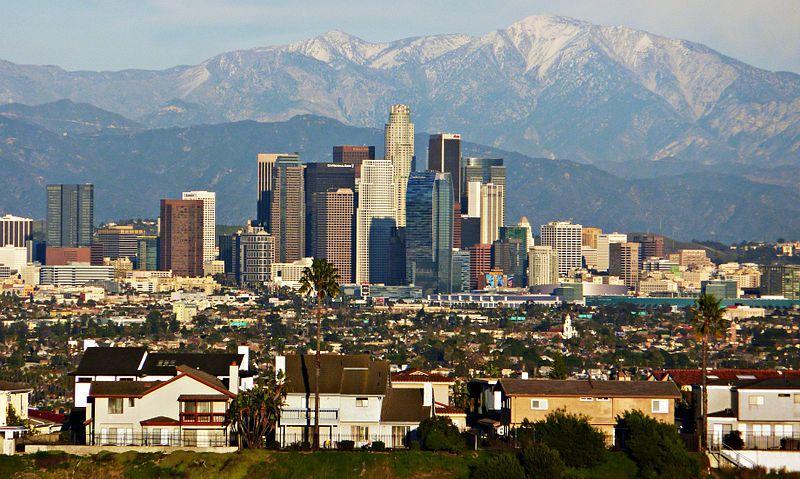
Metros sending the most people to Los Angeles
BDS2006 // Wikimedia
Metros sending the most people to Los Angeles
compiled a list of metros that are sending the most people to Los Angeles-Long Beach-Anaheim, CA Metro Area using data from the U.S. Census Bureau. Metros are ranked by the estimated number of people who moved to Los Angeles from the metro between 2015 and 2019. Ties were broken by gross migration.
You may also like: Where people in Los Angeles are moving to most
![]()

California Droning // Shutterstock
#50. Vallejo, CA Metro Area
– Migration to Los Angeles from Vallejo in 2015-2019: 803 (#4 most common destination from Vallejo)
– Migration from Los Angeles to Vallejo: 1,244 (#43 most common destination from Los Angeles)
– Net migration: 441 to Vallejo

Stan Shebs // Wikicommons
#49. Napa, CA Metro Area
– Migration to Los Angeles from Napa in 2015-2019: 810 (#3 most common destination from Napa)
– Migration from Los Angeles to Napa: 421 (#97 most common destination from Los Angeles)
– Net migration: 389 to Los Angeles

Wikimedia
#48. Oklahoma City, OK Metro Area
– Migration to Los Angeles from Oklahoma City in 2015-2019: 823 (#6 most common destination from Oklahoma City)
– Migration from Los Angeles to Oklahoma City: 508 (#82 most common destination from Los Angeles)
– Net migration: 315 to Los Angeles

M.Bucka // Wikimedia Commons
#47. Albuquerque, NM Metro Area
– Migration to Los Angeles from Albuquerque in 2015-2019: 833 (#7 most common destination from Albuquerque)
– Migration from Los Angeles to Albuquerque: 860 (#62 most common destination from Los Angeles)
– Net migration: 27 to Albuquerque
Little Mountain 5 // Wikicommons
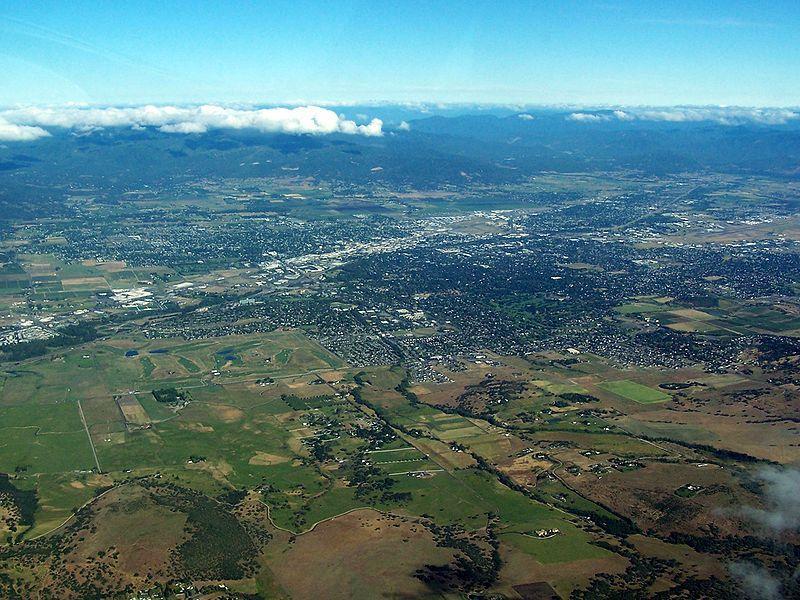
#46. Medford, OR Metro Area
– Migration to Los Angeles from Medford in 2015-2019: 846 (#3 most common destination from Medford)
– Migration from Los Angeles to Medford: 430 (#95 most common destination from Los Angeles)
– Net migration: 416 to Los Angeles
You may also like: Highest-rated brunch restaurants in Los Angeles, according to Tripadvisor

Canva
#45. Cleveland-Elyria, OH Metro Area
– Migration to Los Angeles from Cleveland in 2015-2019: 877 (#15 most common destination from Cleveland)
– Migration from Los Angeles to Cleveland: 689 (#72 most common destination from Los Angeles)
– Net migration: 188 to Los Angeles
![]()
VISALIA2010 // Wikicommons
#44. Visalia, CA Metro Area
– Migration to Los Angeles from Visalia in 2015-2019: 926 (#4 most common destination from Visalia)
– Migration from Los Angeles to Visalia: 1,356 (#39 most common destination from Los Angeles)
– Net migration: 430 to Visalia

Sean Pavone // Shutterstock
#43. Columbus, OH Metro Area
– Migration to Los Angeles from Columbus in 2015-2019: 942 (#13 most common destination from Columbus)
– Migration from Los Angeles to Columbus: 889 (#61 most common destination from Los Angeles)
– Net migration: 53 to Los Angeles

JonathanVictor // Wikimedia
#42. Bridgeport-Stamford-Norwalk, CT Metro Area
– Migration to Los Angeles from Bridgeport in 2015-2019: 968 (#8 most common destination from Bridgeport)
– Migration from Los Angeles to Bridgeport: 225 (#145 most common destination from Los Angeles)
– Net migration: 743 to Los Angeles

Epccedu // Wikimedia Commons
#41. El Paso, TX Metro Area
– Migration to Los Angeles from El Paso in 2015-2019: 991 (#6 most common destination from El Paso)
– Migration from Los Angeles to El Paso: 737 (#69 most common destination from Los Angeles)
– Net migration: 254 to Los Angeles
You may also like: Zip codes with the most expensive rent in Los Angeles

Pedro Szekely // flickr
#40. New Orleans-Metairie, LA Metro Area
– Migration to Los Angeles from New Orleans in 2015-2019: 994 (#8 most common destination from New Orleans)
– Migration from Los Angeles to New Orleans: 780 (#66 most common destination from Los Angeles)
– Net migration: 214 to Los Angeles
Aaronbrick // Wikicommons
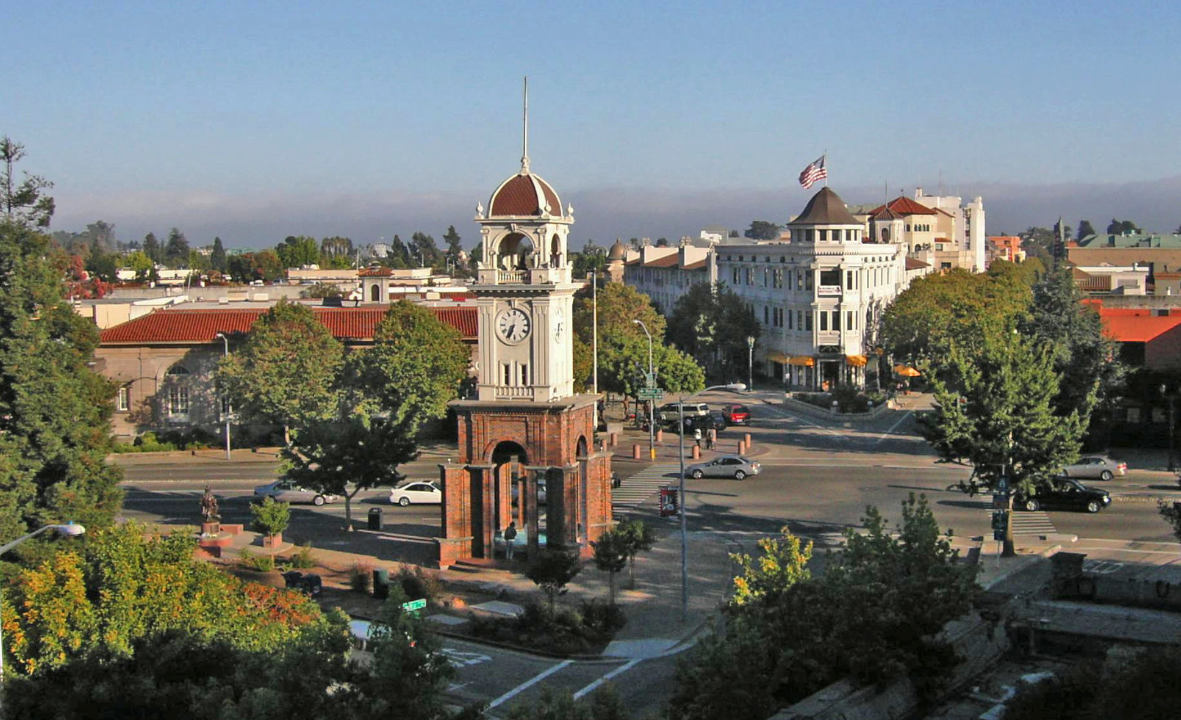
#39. Santa Cruz-Watsonville, CA Metro Area
– Migration to Los Angeles from Santa Cruz in 2015-2019: 1,019 (#4 most common destination from Santa Cruz)
– Migration from Los Angeles to Santa Cruz: 1,644 (#33 most common destination from Los Angeles)
– Net migration: 625 to Santa Cruz

ESB Professional // Shutterstock
#38. Pittsburgh, PA Metro Area
– Migration to Los Angeles from Pittsburgh in 2015-2019: 1,027 (#12 most common destination from Pittsburgh)
– Migration from Los Angeles to Pittsburgh: 481 (#84 most common destination from Los Angeles)
– Net migration: 546 to Los Angeles
Zereshk // Wikimedia
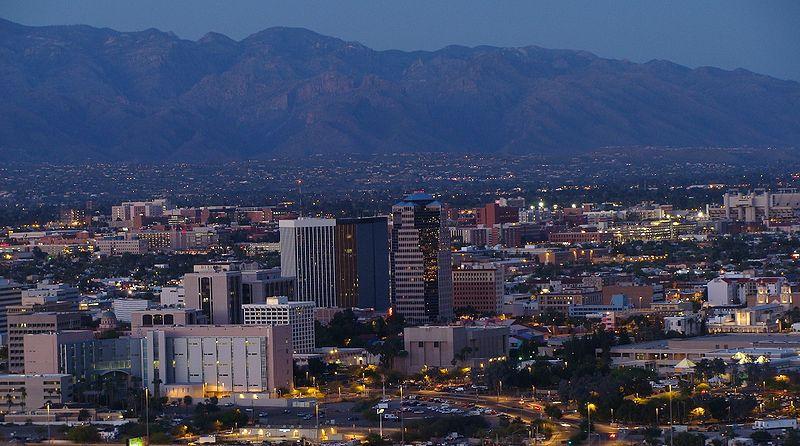
#37. Tucson, AZ Metro Area
– Migration to Los Angeles from Tucson in 2015-2019: 1,029 (#3 most common destination from Tucson)
– Migration from Los Angeles to Tucson: 2,319 (#26 most common destination from Los Angeles)
– Net migration: 1,290 to Tucson

Songquan Deng // Shutterstock
#36. Orlando-Kissimmee-Sanford, FL Metro Area
– Migration to Los Angeles from Orlando in 2015-2019: 1,115 (#19 most common destination from Orlando)
– Migration from Los Angeles to Orlando: 985 (#54 most common destination from Los Angeles)
– Net migration: 130 to Los Angeles
You may also like: Highest-rated pizza restaurants in Los Angeles, according to Tripadvisor

Robert Corby // Wikimedia Commons
#35. Colorado Springs, CO Metro Area
– Migration to Los Angeles from Colorado Springs in 2015-2019: 1,162 (#4 most common destination from Colorado Springs)
– Migration from Los Angeles to Colorado Springs: 1,221 (#44 most common destination from Los Angeles)
– Net migration: 59 to Colorado Springs

f11photo // Shutterstock
#34. Nashville-Davidson–Murfreesboro–Franklin, TN Metro Area
– Migration to Los Angeles from Nashville in 2015-2019: 1,177 (#8 most common destination from Nashville)
– Migration from Los Angeles to Nashville: 2,030 (#29 most common destination from Los Angeles)
– Net migration: 853 to Nashville

Skyguy414 // Wikicommons
#33. Salt Lake City, UT Metro Area
– Migration to Los Angeles from Salt Lake City in 2015-2019: 1,222 (#6 most common destination from Salt Lake City)
– Migration from Los Angeles to Salt Lake City: 1,655 (#32 most common destination from Los Angeles)
– Net migration: 433 to Salt Lake City

BusinessEditorUSA // Wikimedia Commons
#32. Charlotte-Concord-Gastonia, NC-SC Metro Area
– Migration to Los Angeles from Charlotte in 2015-2019: 1,225 (#17 most common destination from Charlotte)
– Migration from Los Angeles to Charlotte: 1,324 (#41 most common destination from Los Angeles)
– Net migration: 99 to Charlotte
Armona // Wikicommons
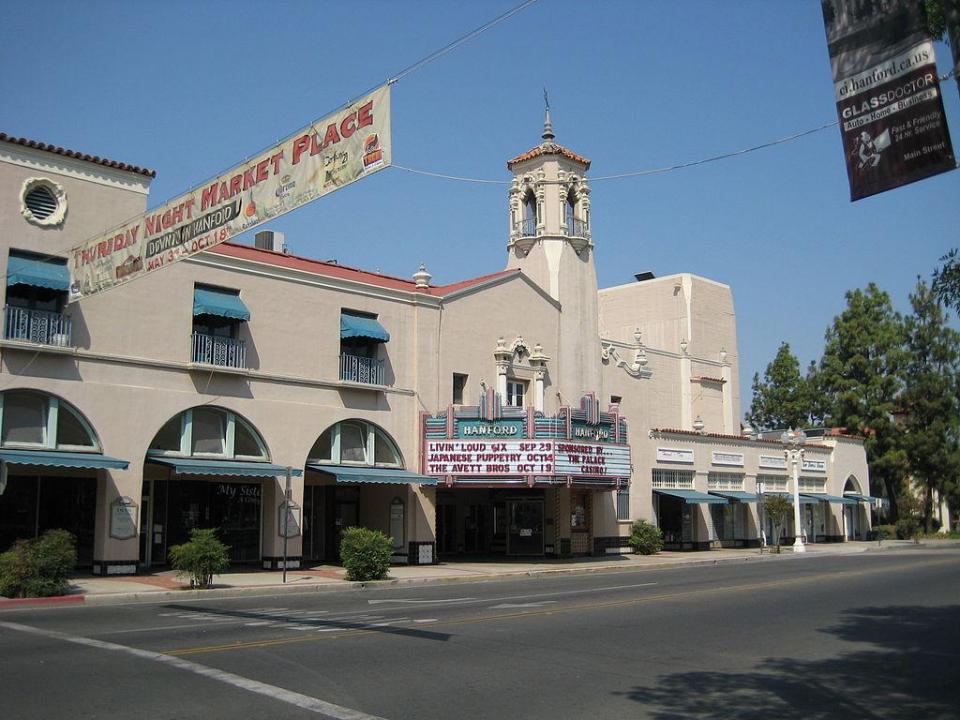
#31. Hanford-Corcoran, CA Metro Area
– Migration to Los Angeles from Hanford in 2015-2019: 1,251 (#1 most common destination from Hanford)
– Migration from Los Angeles to Hanford: 897 (#60 most common destination from Los Angeles)
– Net migration: 354 to Los Angeles
You may also like: Highest-rated seafood restaurants in Los Angeles, according to Tripadvisor
Naotake Murayama // Wikicommons
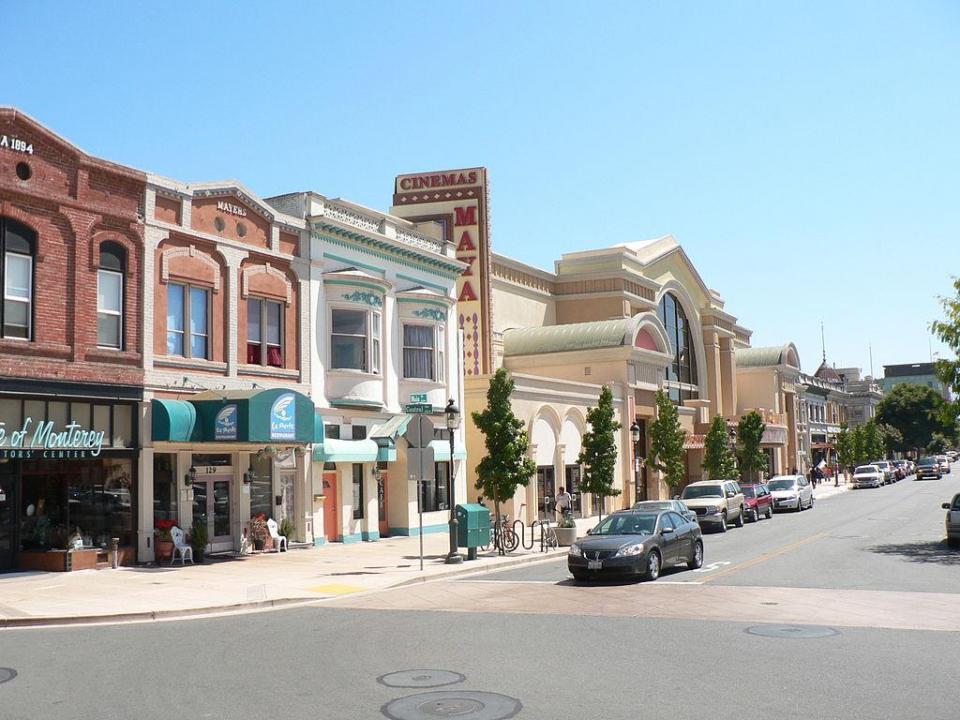
#30. Salinas, CA Metro Area
– Migration to Los Angeles from Salinas in 2015-2019: 1,290 (#2 most common destination from Salinas)
– Migration from Los Angeles to Salinas: 1,396 (#38 most common destination from Los Angeles)
– Net migration: 106 to Salinas
Basar // Wikicommons
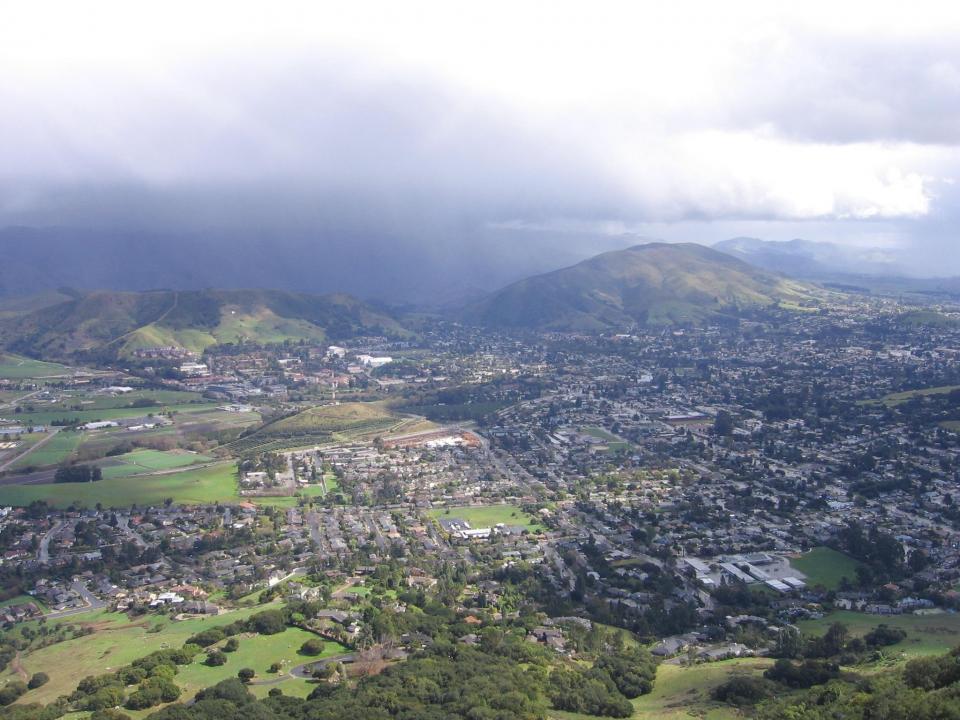
#29. San Luis Obispo-Paso Robles, CA Metro Area
– Migration to Los Angeles from San Luis Obispo in 2015-2019: 1,296 (#2 most common destination from San Luis Obispo)
– Migration from Los Angeles to San Luis Obispo: 3,093 (#22 most common destination from Los Angeles)
– Net migration: 1,797 to San Luis Obispo

PhotosByMahin // Pixabay
#28. Detroit-Warren-Dearborn, MI Metro Area
– Migration to Los Angeles from Detroit in 2015-2019: 1,312 (#14 most common destination from Detroit)
– Migration from Los Angeles to Detroit: 966 (#56 most common destination from Los Angeles)
– Net migration: 346 to Los Angeles

Pixabay
#27. Austin-Round Rock-Georgetown, TX Metro Area
– Migration to Los Angeles from Austin in 2015-2019: 1,473 (#8 most common destination from Austin)
– Migration from Los Angeles to Austin: 3,849 (#19 most common destination from Los Angeles)
– Net migration: 2,376 to Austin

Famartin // Wikicommons
#26. Baltimore-Columbia-Towson, MD Metro Area
– Migration to Los Angeles from Baltimore in 2015-2019: 1,656 (#7 most common destination from Baltimore)
– Migration from Los Angeles to Baltimore: 1,187 (#46 most common destination from Los Angeles)
– Net migration: 469 to Los Angeles
You may also like: Lowest-paying jobs in Los Angeles
Tony Webster // Wikicommons
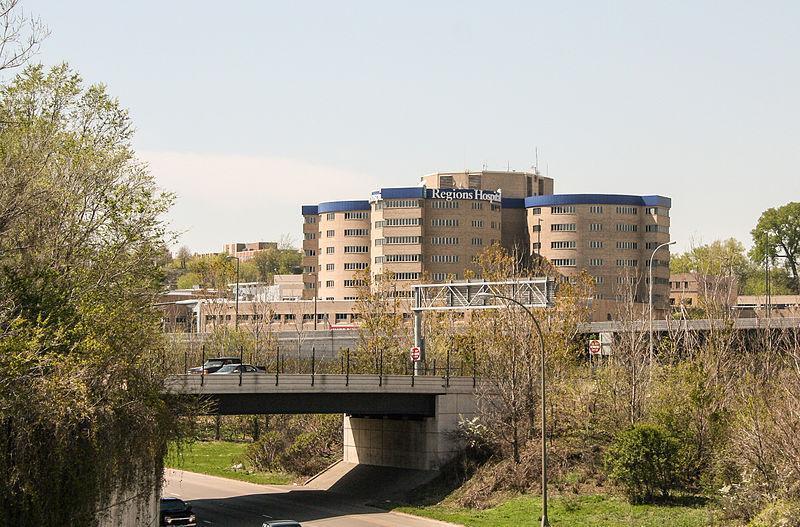
#25. Minneapolis-St. Paul-Bloomington, MN-WI Metro Area
– Migration to Los Angeles from Minneapolis in 2015-2019: 1,820 (#9 most common destination from Minneapolis)
– Migration from Los Angeles to Minneapolis: 1,698 (#30 most common destination from Los Angeles)
– Net migration: 122 to Los Angeles
David Jordan // Wikicommons
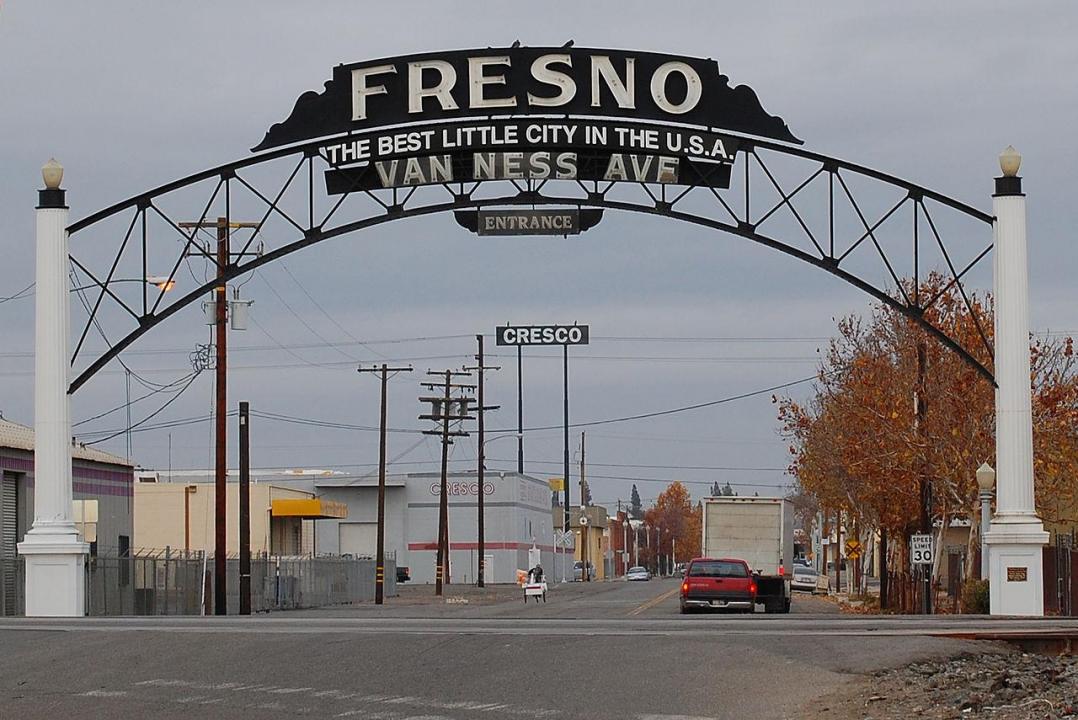
#24. Fresno, CA Metro Area
– Migration to Los Angeles from Fresno in 2015-2019: 2,228 (#1 most common destination from Fresno)
– Migration from Los Angeles to Fresno: 2,647 (#23 most common destination from Los Angeles)
– Net migration: 419 to Fresno

Edmund Garman // Flickr
#23. Urban Honolulu, HI Metro Area
– Migration to Los Angeles from Urban Honolulu in 2015-2019: 2,229 (#2 most common destination from Urban Honolulu)
– Migration from Los Angeles to Urban Honolulu: 2,526 (#25 most common destination from Los Angeles)
– Net migration: 297 to Urban Honolulu

Stuart Seeger // Wikicommons
#22. Portland-Vancouver-Hillsboro, OR-WA Metro Area
– Migration to Los Angeles from Portland in 2015-2019: 2,300 (#8 most common destination from Portland)
– Migration from Los Angeles to Portland: 5,101 (#14 most common destination from Los Angeles)
– Net migration: 2,801 to Portland

skeeze // Pixabay
#21. Houston-The Woodlands-Sugar Land, TX Metro Area
– Migration to Los Angeles from Houston in 2015-2019: 2,468 (#12 most common destination from Houston)
– Migration from Los Angeles to Houston: 4,601 (#16 most common destination from Los Angeles)
– Net migration: 2,133 to Houston
You may also like: Highest-rated Asian restaurants in Los Angeles, according to Tripadvisor
Kolossos // Wikimedia Commons
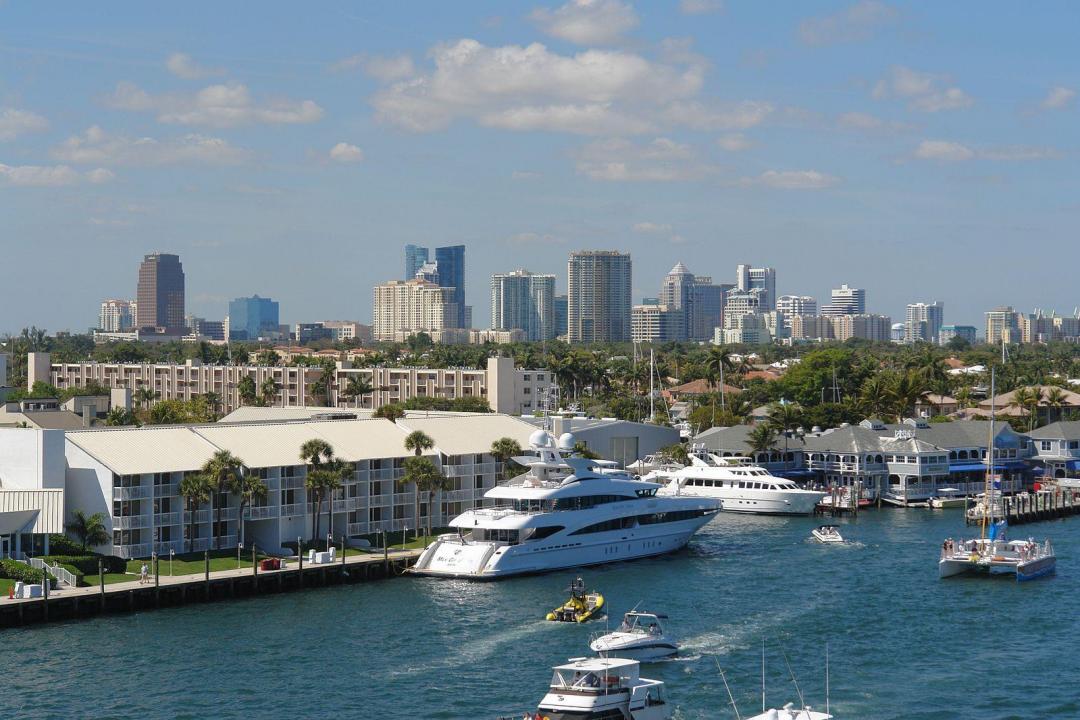
#20. Miami-Fort Lauderdale-Pompano Beach, FL Metro Area
– Migration to Los Angeles from Miami in 2015-2019: 2,586 (#14 most common destination from Miami)
– Migration from Los Angeles to Miami: 2,531 (#24 most common destination from Los Angeles)
– Net migration: 55 to Los Angeles

Pixabay
#19. Santa Maria-Santa Barbara, CA Metro Area
– Migration to Los Angeles from Santa Maria in 2015-2019: 2,727 (#1 most common destination from Santa Maria)
– Migration from Los Angeles to Santa Maria: 5,424 (#13 most common destination from Los Angeles)
– Net migration: 2,697 to Santa Maria

f11photo // Shutterstock
#18. Denver-Aurora-Lakewood, CO Metro Area
– Migration to Los Angeles from Denver in 2015-2019: 2,875 (#7 most common destination from Denver)
– Migration from Los Angeles to Denver: 4,347 (#18 most common destination from Los Angeles)
– Net migration: 1,472 to Denver

f11photo // Shutterstock
#17. Philadelphia-Camden-Wilmington, PA-NJ-DE-MD Metro Area
– Migration to Los Angeles from Philadelphia in 2015-2019: 2,963 (#15 most common destination from Philadelphia)
– Migration from Los Angeles to Philadelphia: 1,617 (#34 most common destination from Los Angeles)
– Net migration: 1,346 to Los Angeles

Keizers // Wikimedia Commons
#16. Atlanta-Sandy Springs-Alpharetta, GA Metro Area
– Migration to Los Angeles from Atlanta in 2015-2019: 3,002 (#14 most common destination from Atlanta)
– Migration from Los Angeles to Atlanta: 3,537 (#20 most common destination from Los Angeles)
– Net migration: 535 to Atlanta
You may also like: Highest-paying jobs in Los Angeles that don’t require a college degree

Alan Botting // Wikimedia Commons
#15. Dallas-Fort Worth-Arlington, TX Metro Area
– Migration to Los Angeles from Dallas in 2015-2019: 4,496 (#6 most common destination from Dallas)
– Migration from Los Angeles to Dallas: 10,312 (#8 most common destination from Los Angeles)
– Net migration: 5,816 to Dallas

Sean Pavone // Shutterstock
#14. Boston-Cambridge-Newton, MA-NH Metro Area
– Migration to Los Angeles from Boston in 2015-2019: 4,575 (#8 most common destination from Boston)
– Migration from Los Angeles to Boston: 3,372 (#21 most common destination from Los Angeles)
– Net migration: 1,203 to Los Angeles

nickchapman // Wikicommons
#13. Bakersfield, CA Metro Area
– Migration to Los Angeles from Bakersfield in 2015-2019: 4,769 (#1 most common destination from Bakersfield)
– Migration from Los Angeles to Bakersfield: 11,077 (#6 most common destination from Los Angeles)
– Net migration: 6,308 to Bakersfield

DPPed// Wikimedia
#12. Phoenix-Mesa-Chandler, AZ Metro Area
– Migration to Los Angeles from Phoenix in 2015-2019: 4,904 (#4 most common destination from Phoenix)
– Migration from Los Angeles to Phoenix: 13,273 (#5 most common destination from Los Angeles)
– Net migration: 8,369 to Phoenix

Pixabay
#11. Sacramento-Roseville-Folsom, CA Metro Area
– Migration to Los Angeles from Sacramento in 2015-2019: 4,958 (#2 most common destination from Sacramento)
– Migration from Los Angeles to Sacramento: 10,033 (#9 most common destination from Los Angeles)
– Net migration: 5,075 to Sacramento
You may also like: Highest and lowest paying education jobs in Los Angeles

Andrew Bossi // Wikimedia
#10. Washington-Arlington-Alexandria, DC-VA-MD-WV Metro Area
– Migration to Los Angeles from Washington in 2015-2019: 5,093 (#7 most common destination from Washington)
– Migration from Los Angeles to Washington: 4,514 (#17 most common destination from Los Angeles)
– Net migration: 579 to Los Angeles

randy andy // Shutterstock
#9. Las Vegas-Henderson-Paradise, NV Metro Area
– Migration to Los Angeles from Las Vegas in 2015-2019: 5,220 (#1 most common destination from Las Vegas)
– Migration from Los Angeles to Las Vegas: 15,765 (#4 most common destination from Los Angeles)
– Net migration: 10,545 to Las Vegas
Public Domain
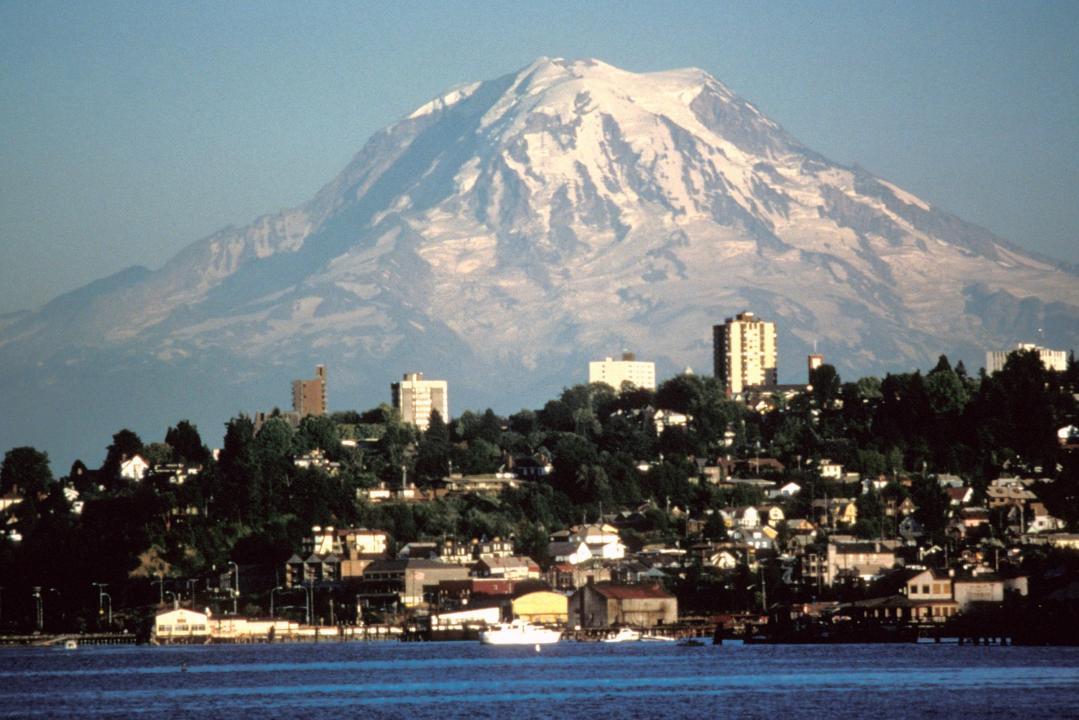
#8. Seattle-Tacoma-Bellevue, WA Metro Area
– Migration to Los Angeles from Seattle in 2015-2019: 5,600 (#5 most common destination from Seattle)
– Migration from Los Angeles to Seattle: 8,677 (#11 most common destination from Los Angeles)
– Net migration: 3,077 to Seattle

Don Ramey Logan // Wikicommons
#7. San Jose-Sunnyvale-Santa Clara, CA Metro Area
– Migration to Los Angeles from San Jose in 2015-2019: 6,353 (#2 most common destination from San Jose)
– Migration from Los Angeles to San Jose: 7,229 (#12 most common destination from Los Angeles)
– Net migration: 876 to San Jose

Christopher & Amy Esposito // Wikicommons
#6. Chicago-Naperville-Elgin, IL-IN-WI Metro Area
– Migration to Los Angeles from Chicago in 2015-2019: 7,263 (#3 most common destination from Chicago)
– Migration from Los Angeles to Chicago: 5,035 (#15 most common destination from Los Angeles)
– Net migration: 2,228 to Los Angeles
You may also like: Cities with the fastest growing home prices in Los Angeles metro area
CameronK23 // Wikimedia Commons
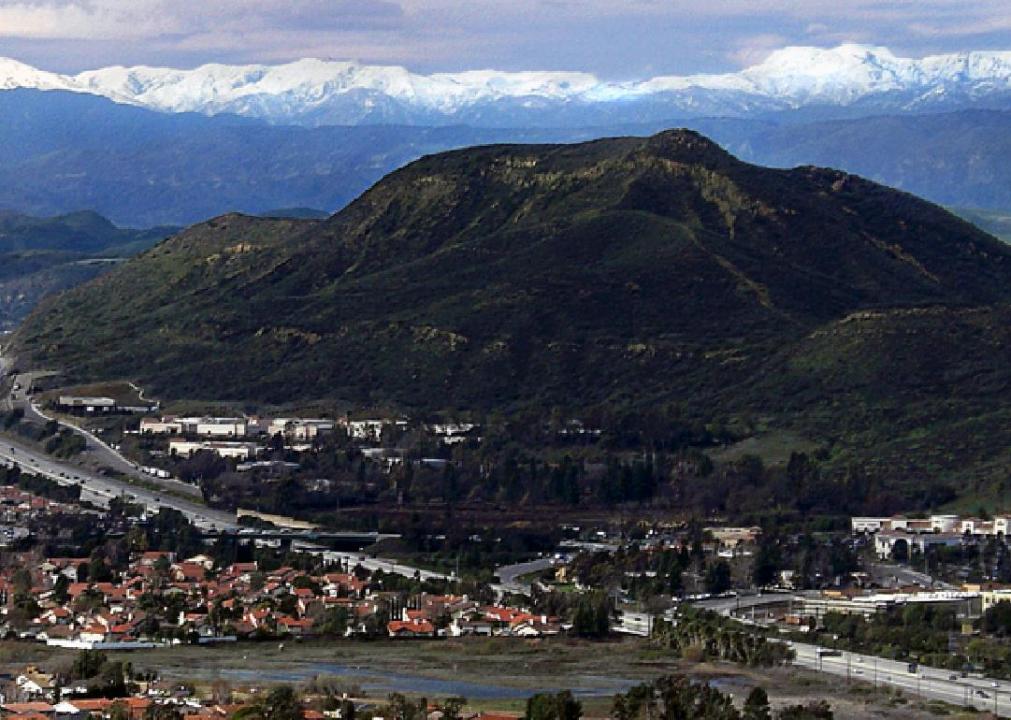
#5. Oxnard-Thousand Oaks-Ventura, CA Metro Area
– Migration to Los Angeles from Oxnard in 2015-2019: 8,342 (#1 most common destination from Oxnard)
– Migration from Los Angeles to Oxnard: 10,514 (#7 most common destination from Los Angeles)
– Net migration: 2,172 to Oxnard

King of Hearts // Wikimedia
#4. New York-Newark-Jersey City, NY-NJ-PA Metro Area
– Migration to Los Angeles from New York in 2015-2019: 15,451 (#4 most common destination from New York)
– Migration from Los Angeles to New York: 8,912 (#10 most common destination from Los Angeles)
– Net migration: 6,539 to Los Angeles

SD Dirk // Flickr
#3. San Diego-Chula Vista-Carlsbad, CA Metro Area
– Migration to Los Angeles from San Diego in 2015-2019: 16,420 (#2 most common destination from San Diego)
– Migration from Los Angeles to San Diego: 17,598 (#3 most common destination from Los Angeles)
– Net migration: 1,178 to San Diego

en:User:Paul.h // Wikimedia
#2. San Francisco-Oakland-Berkeley, CA Metro Area
– Migration to Los Angeles from San Francisco in 2015-2019: 16,425 (#3 most common destination from San Francisco)
– Migration from Los Angeles to San Francisco: 19,738 (#2 most common destination from Los Angeles)
– Net migration: 3,313 to San Francisco
Daniel Orth // Flickr
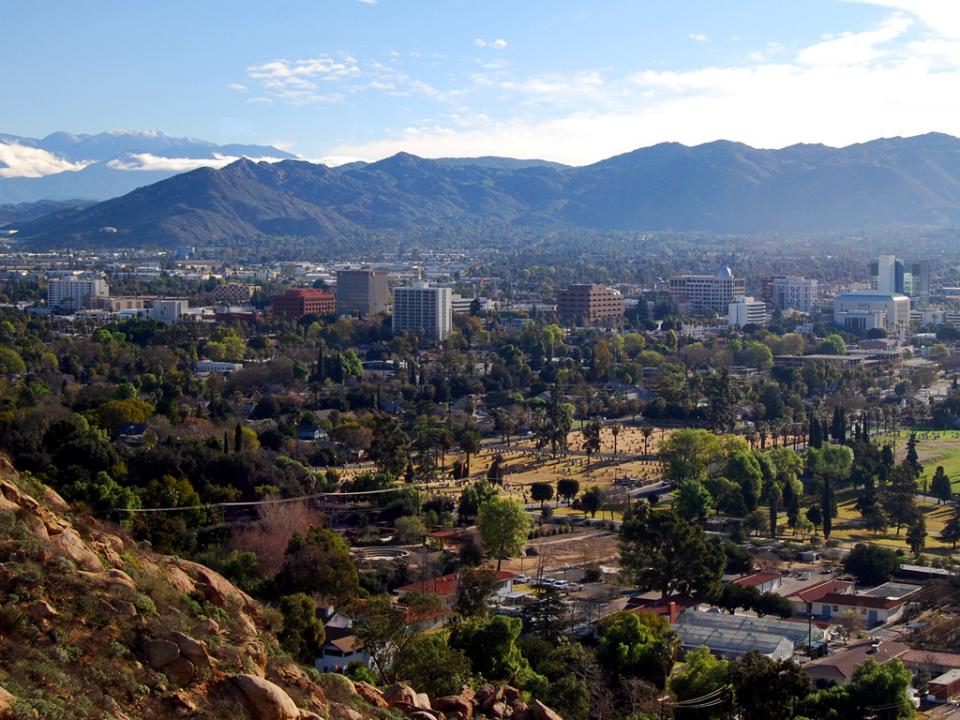
#1. Riverside-San Bernardino-Ontario, CA Metro Area
– Migration to Los Angeles from Riverside in 2015-2019: 40,020 (#1 most common destination from Riverside)
– Migration from Los Angeles to Riverside: 85,533 (#1 most common destination from Los Angeles)
– Net migration: 45,513 to Riverside
You may also like: Highest-rated Italian restaurants in Los Angeles, according to Tripadvisor