Counties with the highest unemployment in California

Canva
Counties with the highest unemployment in California
While significantly lower than the alarming pandemic peak of 14.7% experienced in April 2020, unemployment rates remain a subject of concern, though experts’ views on a potential recession are mixed. The last economic recession—the Great Recession of 2007-2009—sent rates up to 10% as of October 2009. It was not until the spring of 2019 that unemployment finally went down to the same level it sits at now.
As of May 2023, national unemployment is at 3.4%, with little change from April. Seasonally adjusted unemployment rates by state demonstrate a rather sizable spectrum, ranging from just 1.9% in South Dakota to 5.4% in Nevada.
Stacker compiled a list of counties with the highest unemployment rates in California using Bureau of Labor Statistics data. Counties are ranked by their preliminary unemployment rate in May 2023, with initial ties broken by the number of unemployed people within that county, though some ties may remain. County-level unemployment rates are not seasonally adjusted.
![]()
Canva
#58. San Mateo County
– May unemployment rate (preliminary): 2.7%
— 1-month change: Up 0.2 percentage points
— 1-year change: Up 0.7 percentage points
– Total labor force: 454,424 people (12,331 unemployed)
Canva
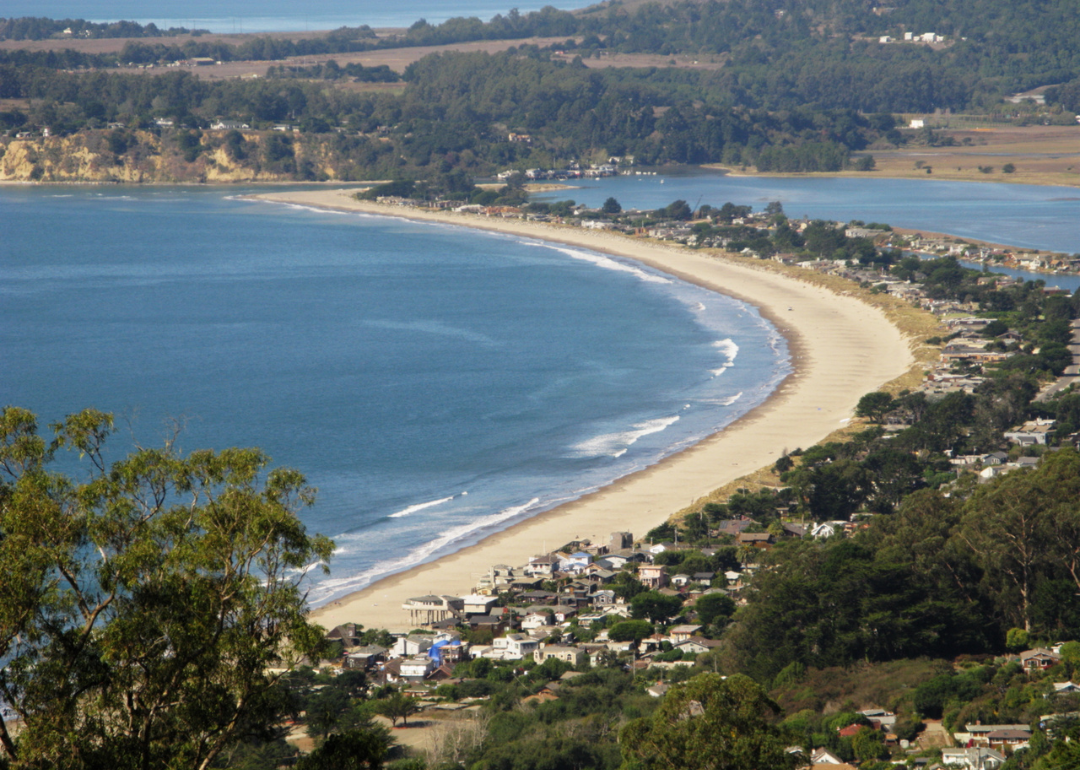
#57. Marin County
– May unemployment rate (preliminary): 3%
— 1-month change: Up 0.1 percentage points
— 1-year change: Up 0.8 percentage points
– Total labor force: 131,411 people (3,940 unemployed)
Canva
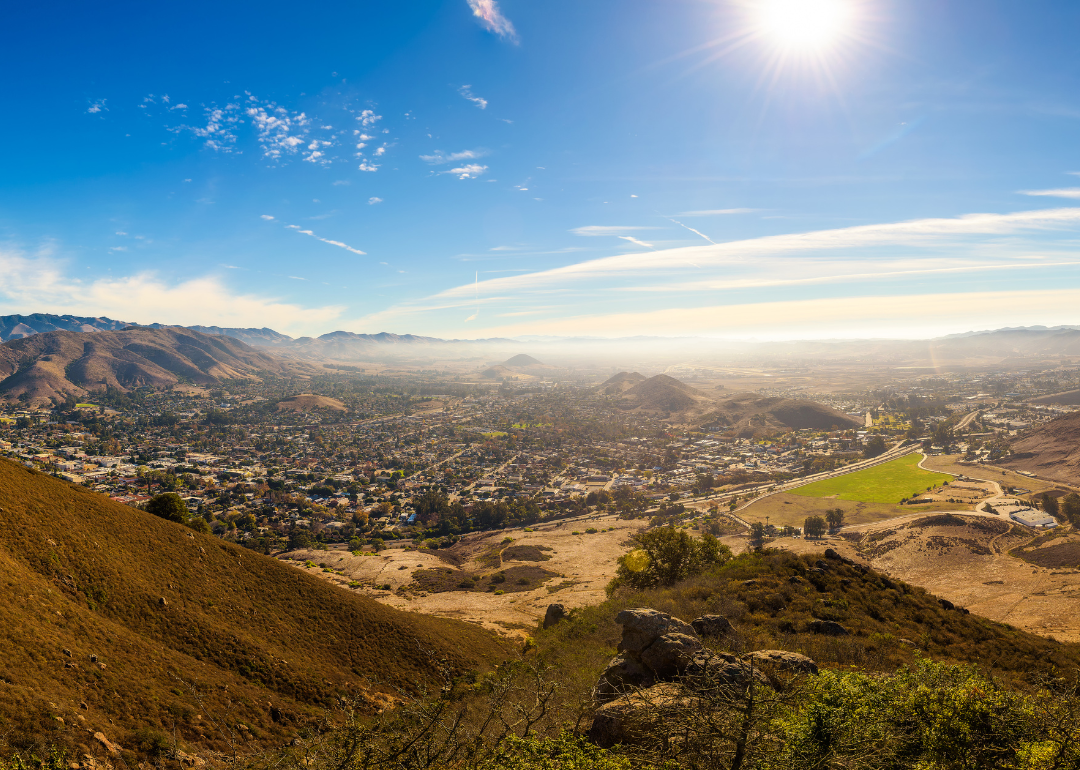
#56. San Luis Obispo County
– May unemployment rate (preliminary): 3%
— 1-month change: No change
— 1-year change: Up 0.5 percentage points
– Total labor force: 139,859 people (4,242 unemployed)

Canva
#55. San Francisco County/city
– May unemployment rate (preliminary): 3%
— 1-month change: Up 0.3 percentage points
— 1-year change: Up 0.9 percentage points
– Total labor force: 574,941 people (17,014 unemployed)

Canva
#54. Napa County
– May unemployment rate (preliminary): 3.1%
— 1-month change: Down 0.1 percentage points
— 1-year change: Up 0.5 percentage points
– Total labor force: 72,104 people (2,271 unemployed)
Uladzik Kryhin // Shutterstock
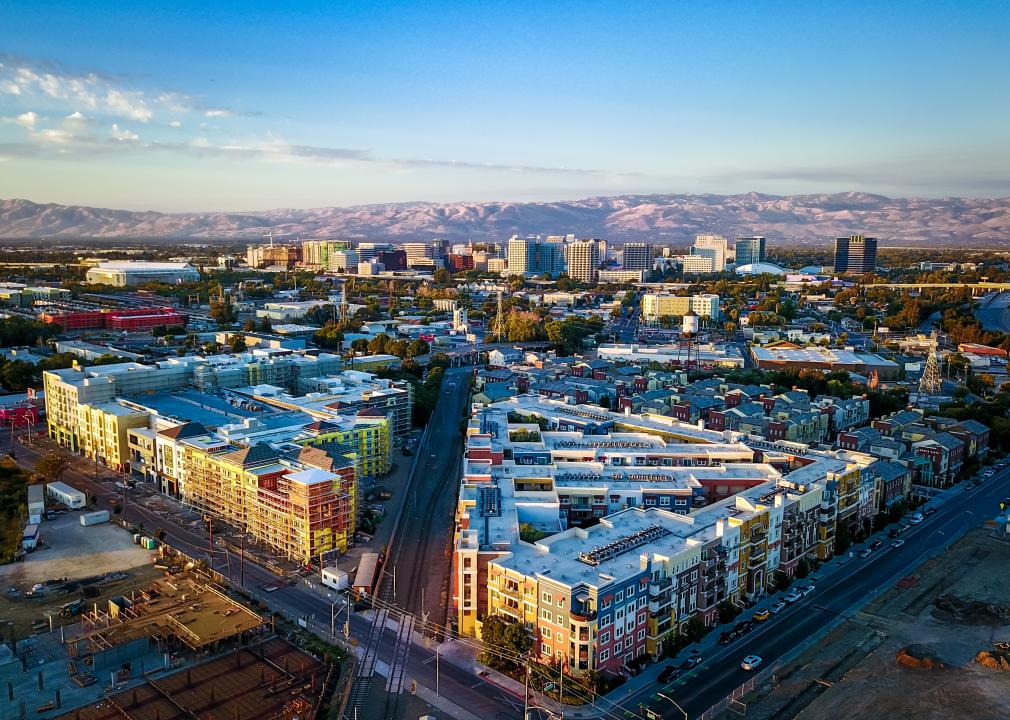
#53. Santa Clara County
– May unemployment rate (preliminary): 3.2%
— 1-month change: Up 0.2 percentage points
— 1-year change: Up 1.0 percentage points
– Total labor force: 1.0 million people (33,344 unemployed)
Canva
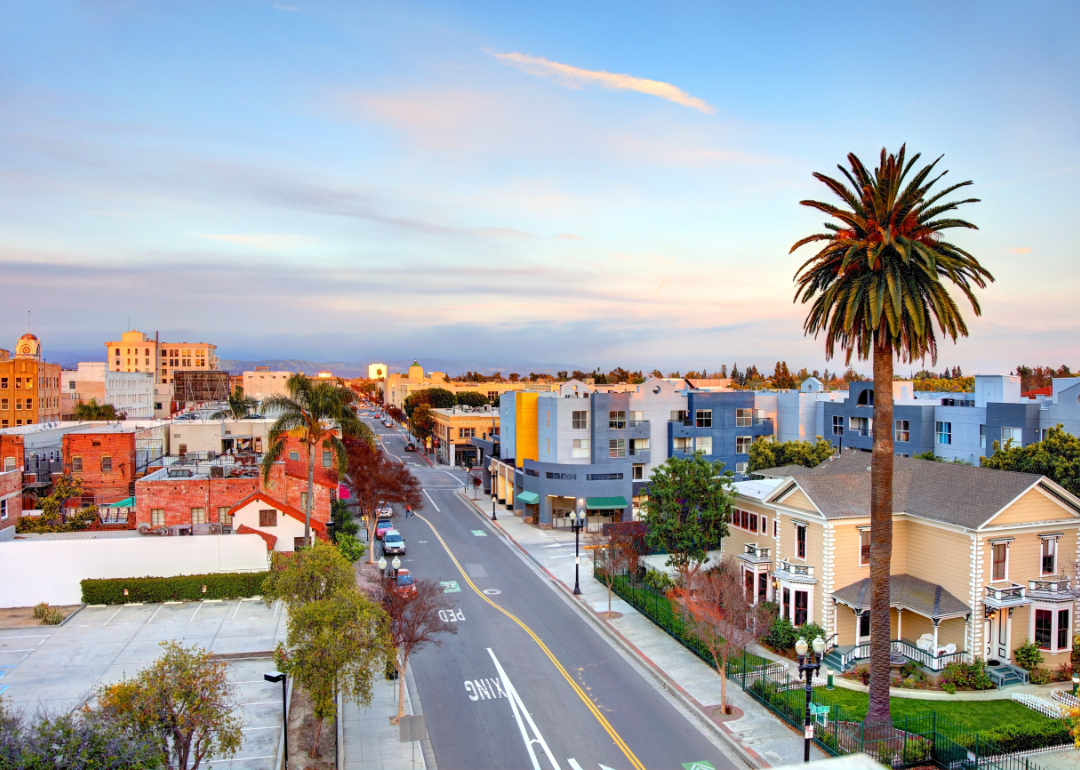
#52. Orange County
– May unemployment rate (preliminary): 3.2%
— 1-month change: Up 0.2 percentage points
— 1-year change: Up 0.5 percentage points
– Total labor force: 1.6 million people (51,196 unemployed)

Canva
#51. Sonoma County
– May unemployment rate (preliminary): 3.3%
— 1-month change: Up 0.1 percentage points
— 1-year change: Up 0.7 percentage points
– Total labor force: 248,283 people (8,277 unemployed)

Canva
#50. Placer County
– May unemployment rate (preliminary): 3.4%
— 1-month change: Up 0.1 percentage points
— 1-year change: Up 0.9 percentage points
– Total labor force: 195,113 people (6,613 unemployed)
Canva
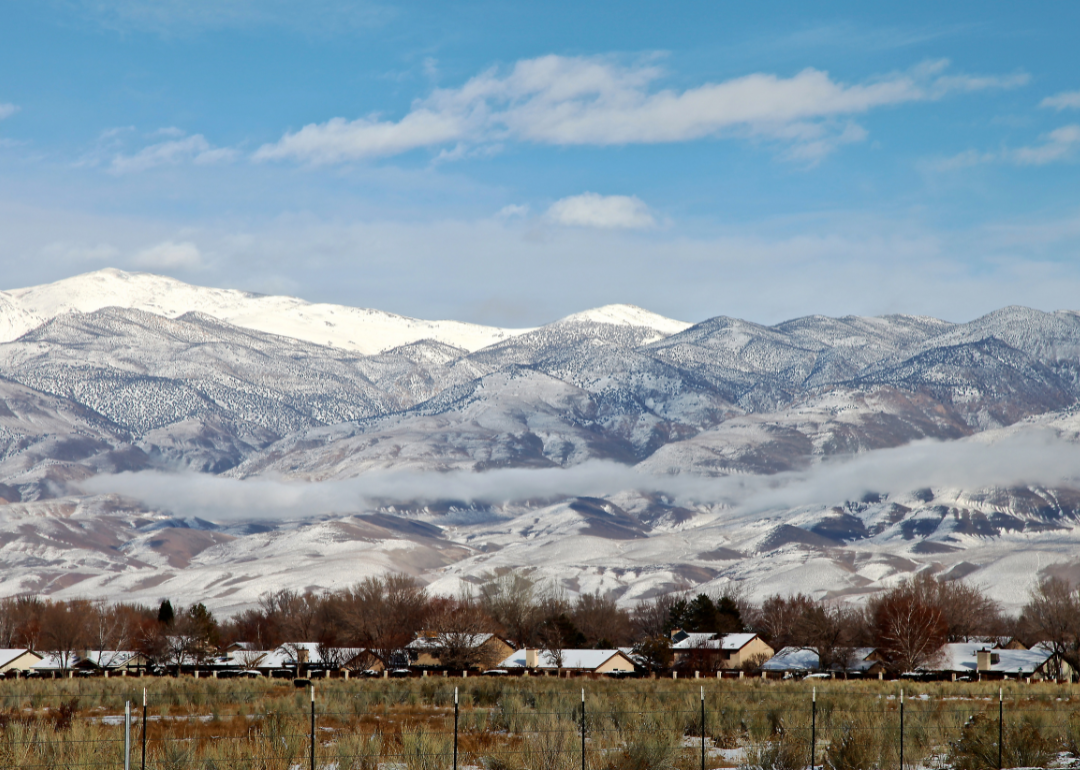
#49. Inyo County
– May unemployment rate (preliminary): 3.5%
— 1-month change: No change
— 1-year change: Up 0.3 percentage points
– Total labor force: 8,260 people (288 unemployed)
Canva
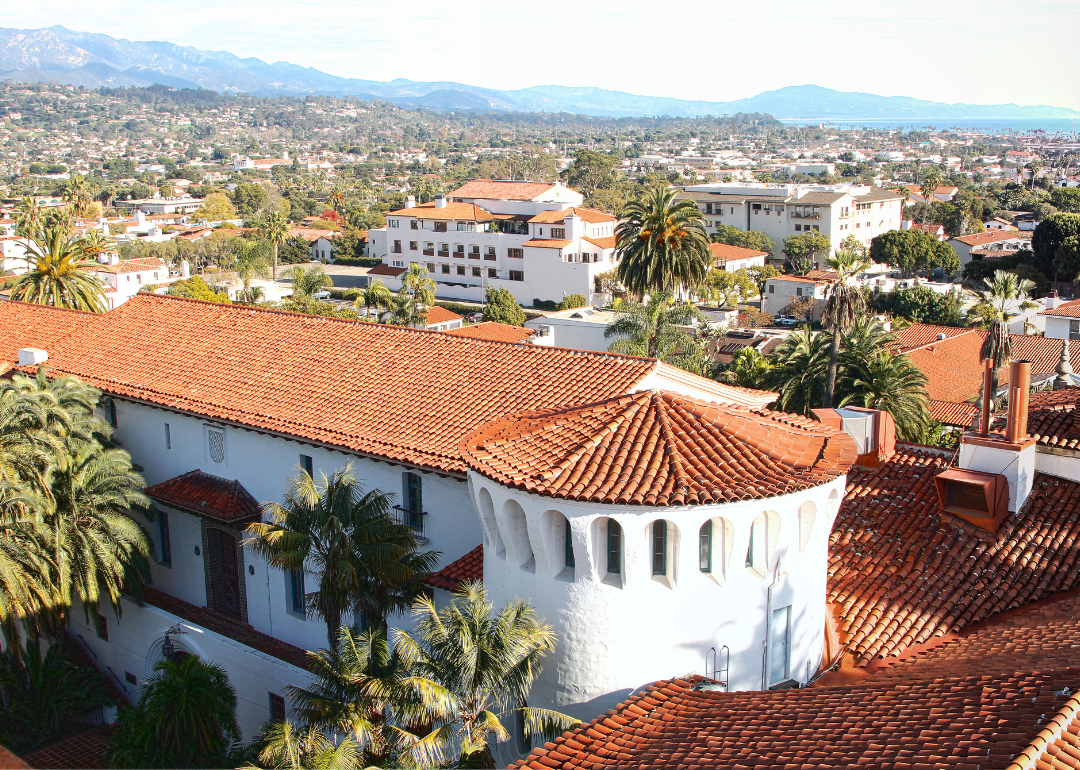
#48. Santa Barbara County
– May unemployment rate (preliminary): 3.5%
— 1-month change: Down 0.2 percentage points
— 1-year change: Up 0.7 percentage points
– Total labor force: 225,464 people (7,852 unemployed)

Canva
#47. San Diego County
– May unemployment rate (preliminary): 3.5%
— 1-month change: Up 0.2 percentage points
— 1-year change: Up 0.6 percentage points
– Total labor force: 1.6 million people (55,649 unemployed)

Canva
#46. El Dorado County
– May unemployment rate (preliminary): 3.6%
— 1-month change: No change
— 1-year change: Up 0.8 percentage points
– Total labor force: 93,826 people (3,414 unemployed)

Canva
#45. Nevada County
– May unemployment rate (preliminary): 3.7%
— 1-month change: No change
— 1-year change: Up 0.8 percentage points
– Total labor force: 47,073 people (1,752 unemployed)
Canva
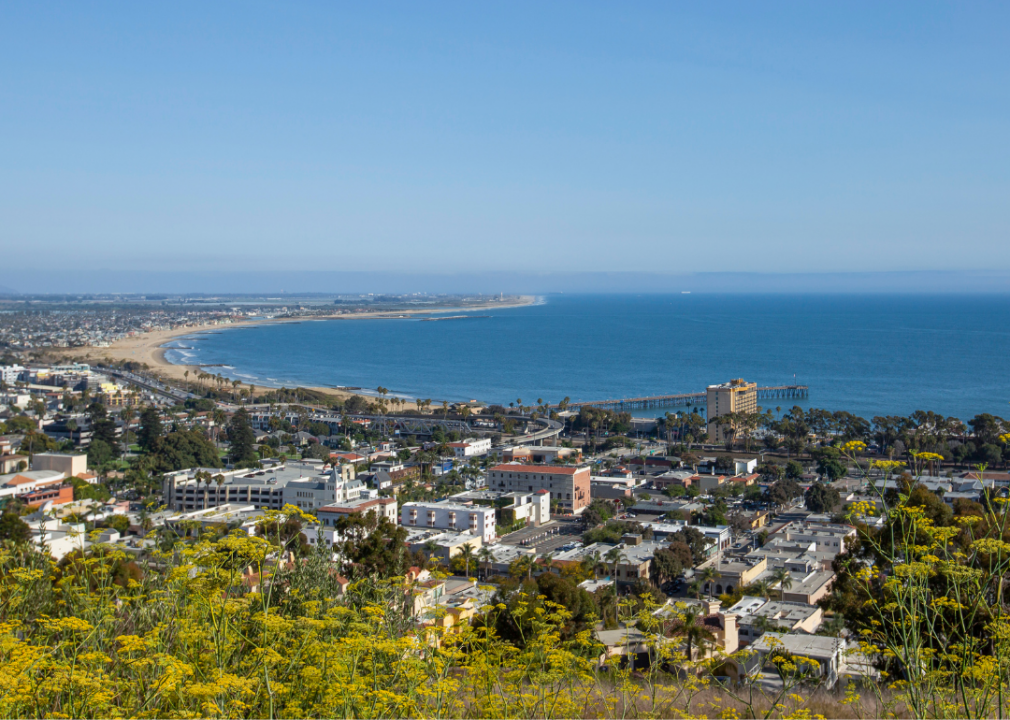
#44. Ventura County
– May unemployment rate (preliminary): 3.7%
— 1-month change: Up 0.1 percentage points
— 1-year change: Up 0.7 percentage points
– Total labor force: 415,829 people (15,436 unemployed)
Canva
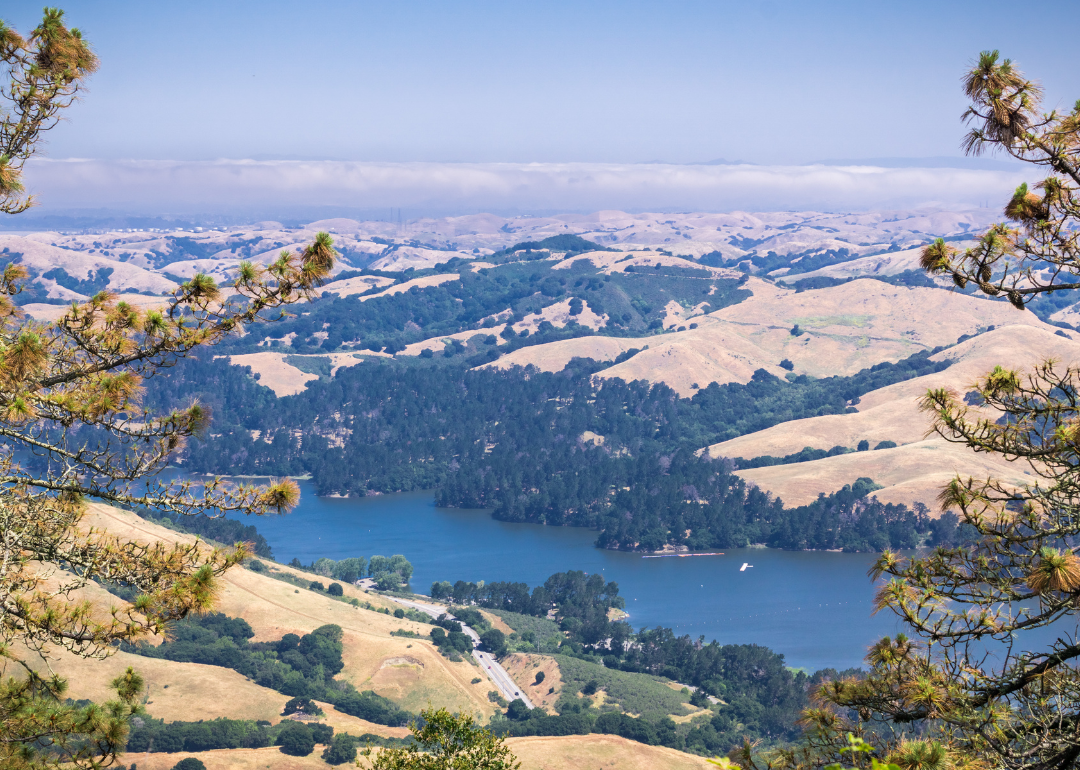
#43. Contra Costa County
– May unemployment rate (preliminary): 3.7%
— 1-month change: Up 0.1 percentage points
— 1-year change: Up 0.7 percentage points
– Total labor force: 551,344 people (20,640 unemployed)
Canva
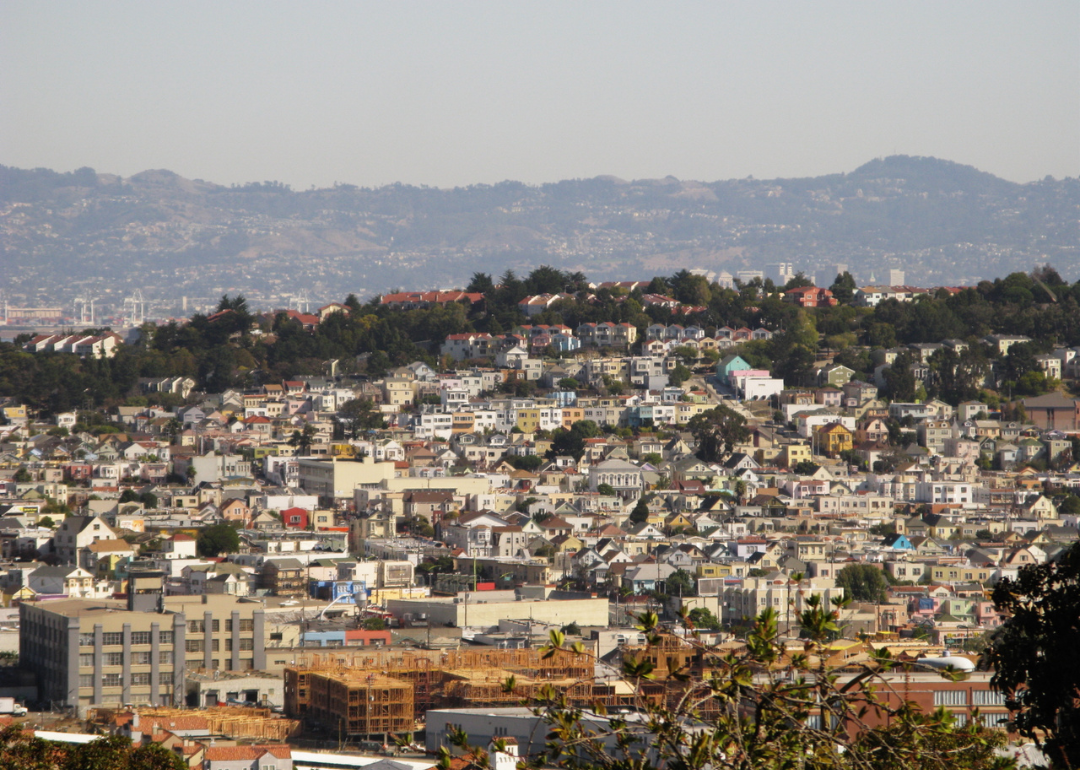
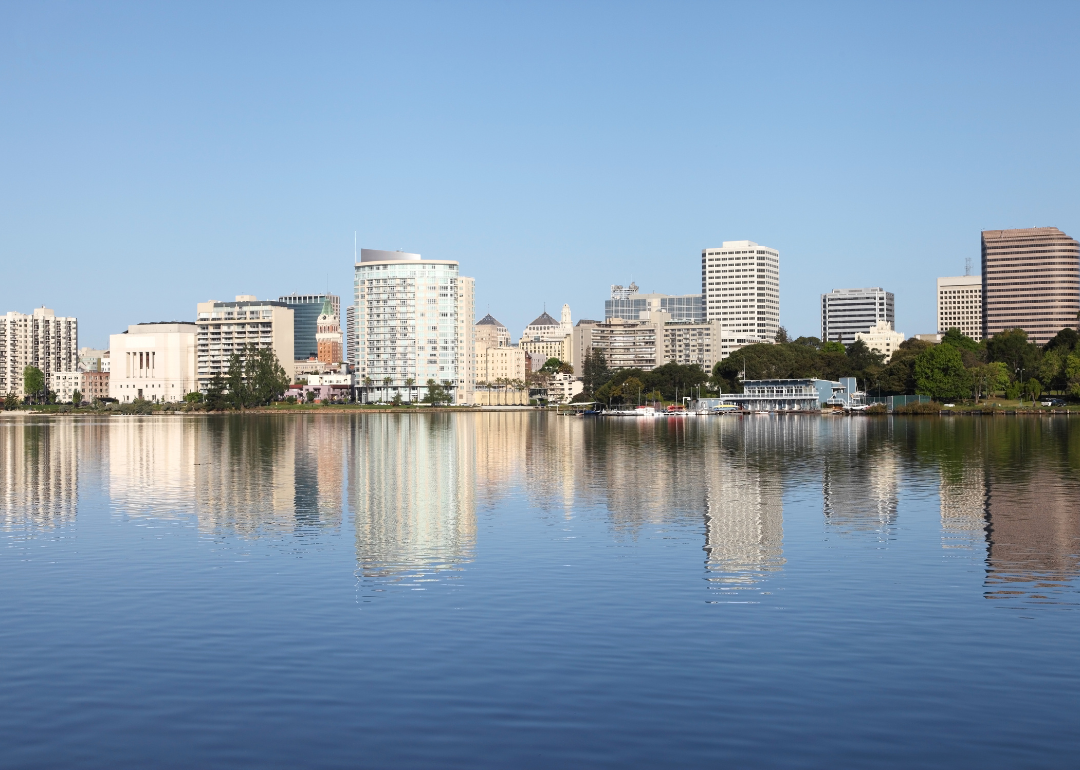
#42. Alameda County
– May unemployment rate (preliminary): 3.7%
— 1-month change: Up 0.2 percentage points
— 1-year change: Up 0.9 percentage points
– Total labor force: 827,429 people (30,400 unemployed)
Canva
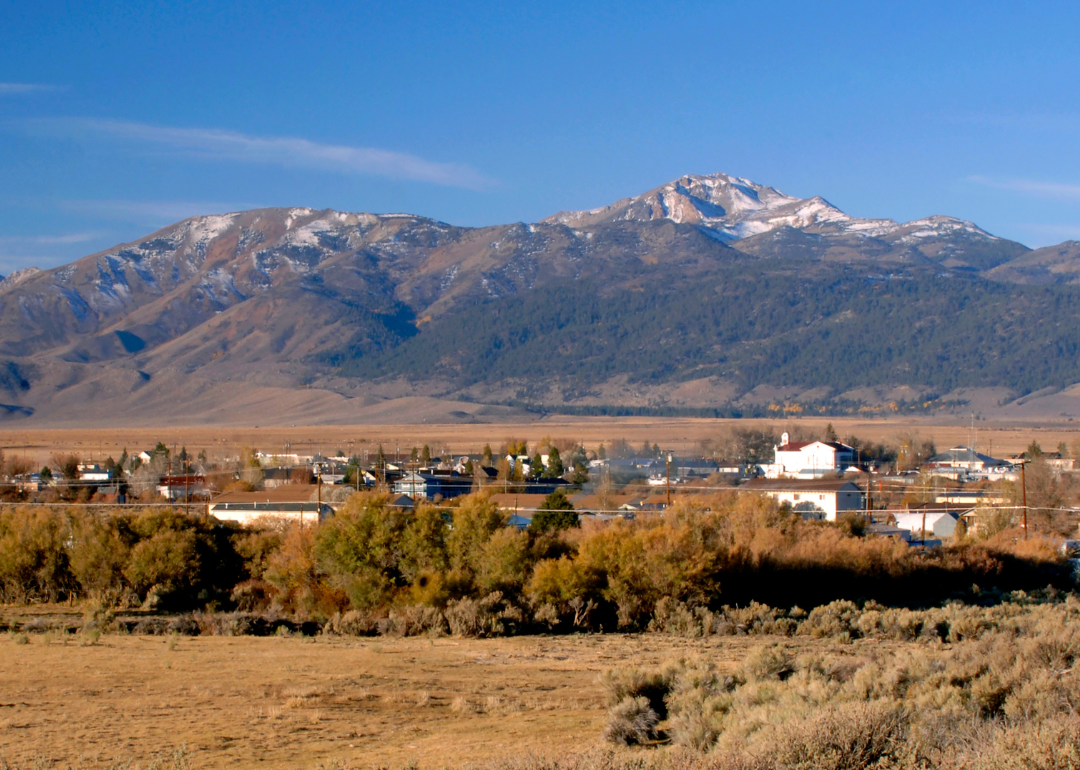
#41. Mono County
– May unemployment rate (preliminary): 3.9%
— 1-month change: Up 0.2 percentage points
— 1-year change: Up 0.9 percentage points
– Total labor force: 8,080 people (313 unemployed)
Canva
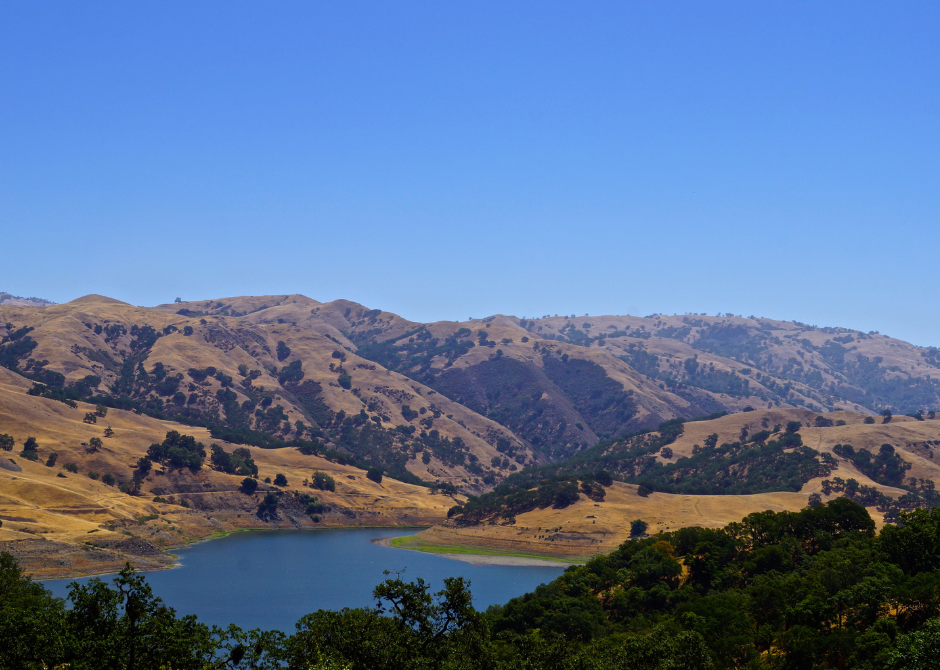
#40. Calaveras County
– May unemployment rate (preliminary): 3.9%
— 1-month change: No change
— 1-year change: Up 0.8 percentage points
– Total labor force: 22,043 people (857 unemployed)

Canva
#39. Sacramento County
– May unemployment rate (preliminary): 4.1%
— 1-month change: Up 0.1 percentage points
— 1-year change: Up 0.8 percentage points
– Total labor force: 732,533 people (29,936 unemployed)

Canva
#38. Yolo County
– May unemployment rate (preliminary): 4.2%
— 1-month change: Down 0.1 percentage points
— 1-year change: Up 0.8 percentage points
– Total labor force: 109,903 people (4,606 unemployed)
Canva
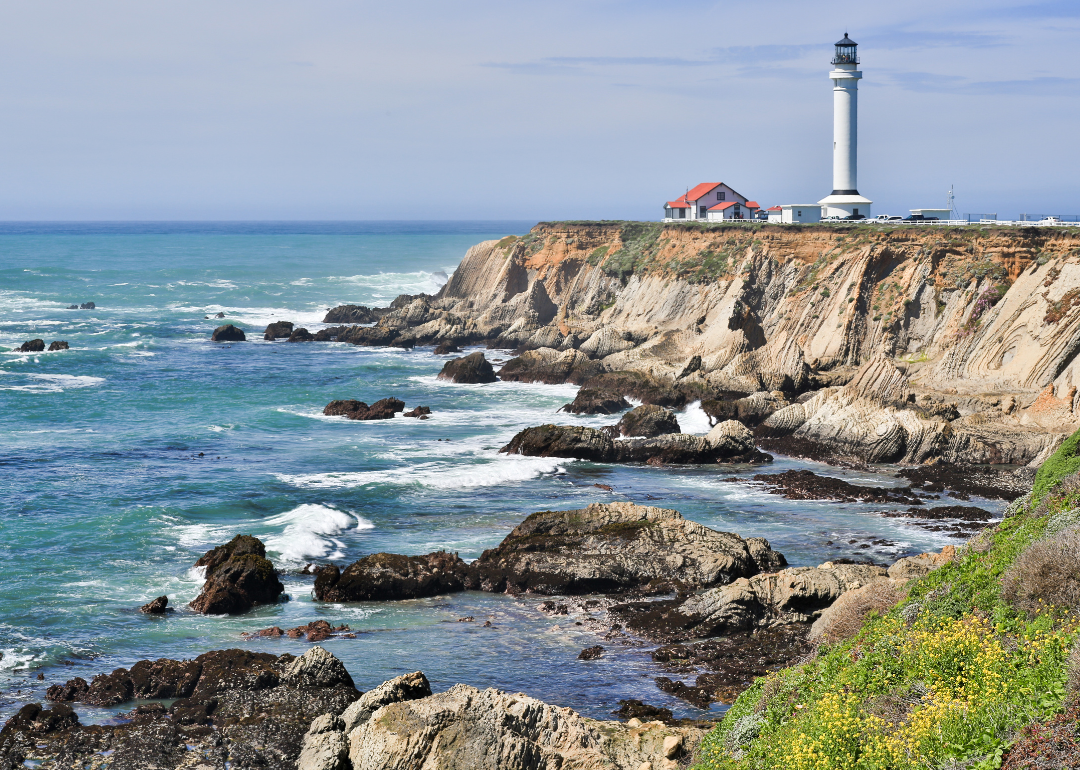
#37. Mendocino County
– May unemployment rate (preliminary): 4.3%
— 1-month change: Down 0.3 percentage points
— 1-year change: Up 0.9 percentage points
– Total labor force: 36,191 people (1,548 unemployed)
Canva
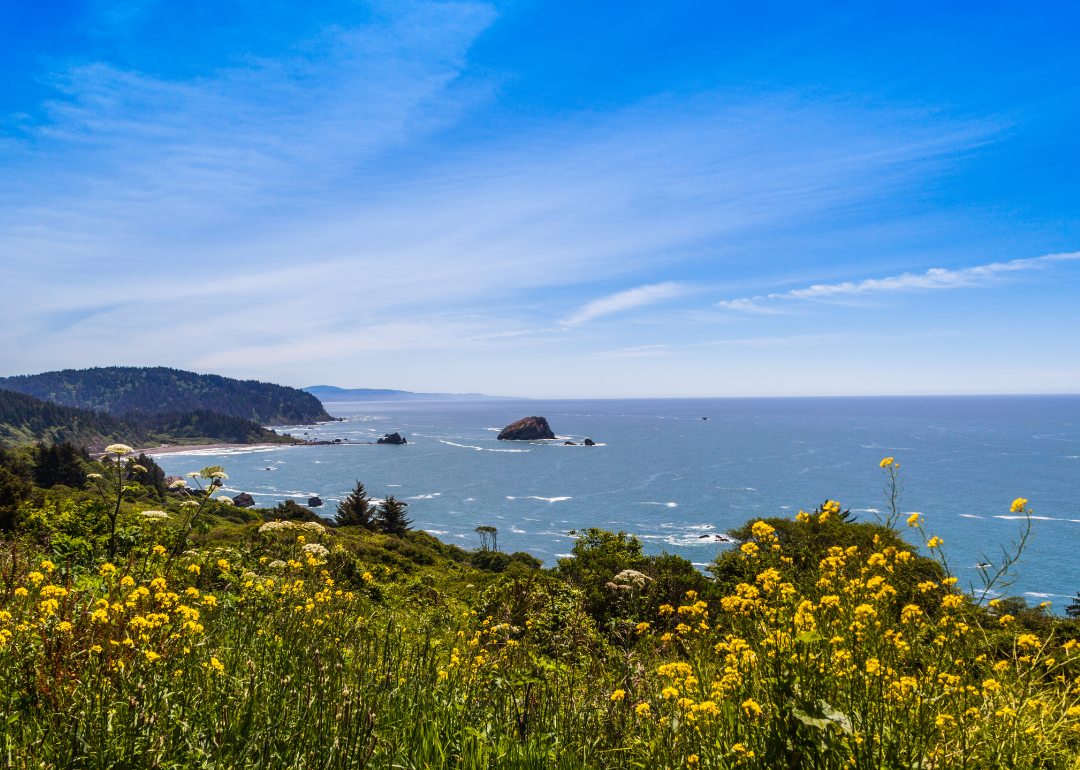
#36. Humboldt County
– May unemployment rate (preliminary): 4.3%
— 1-month change: Up 0.1 percentage points
— 1-year change: Up 0.9 percentage points
– Total labor force: 59,695 people (2,539 unemployed)
Canva
#35. Solano County
– May unemployment rate (preliminary): 4.3%
— 1-month change: Up 0.1 percentage points
— 1-year change: Up 0.7 percentage points
– Total labor force: 202,188 people (8,653 unemployed)
Canva
#34. San Bernardino County
– May unemployment rate (preliminary): 4.3%
— 1-month change: Up 0.2 percentage points
— 1-year change: Up 0.9 percentage points
– Total labor force: 999,528 people (43,378 unemployed)
Canva
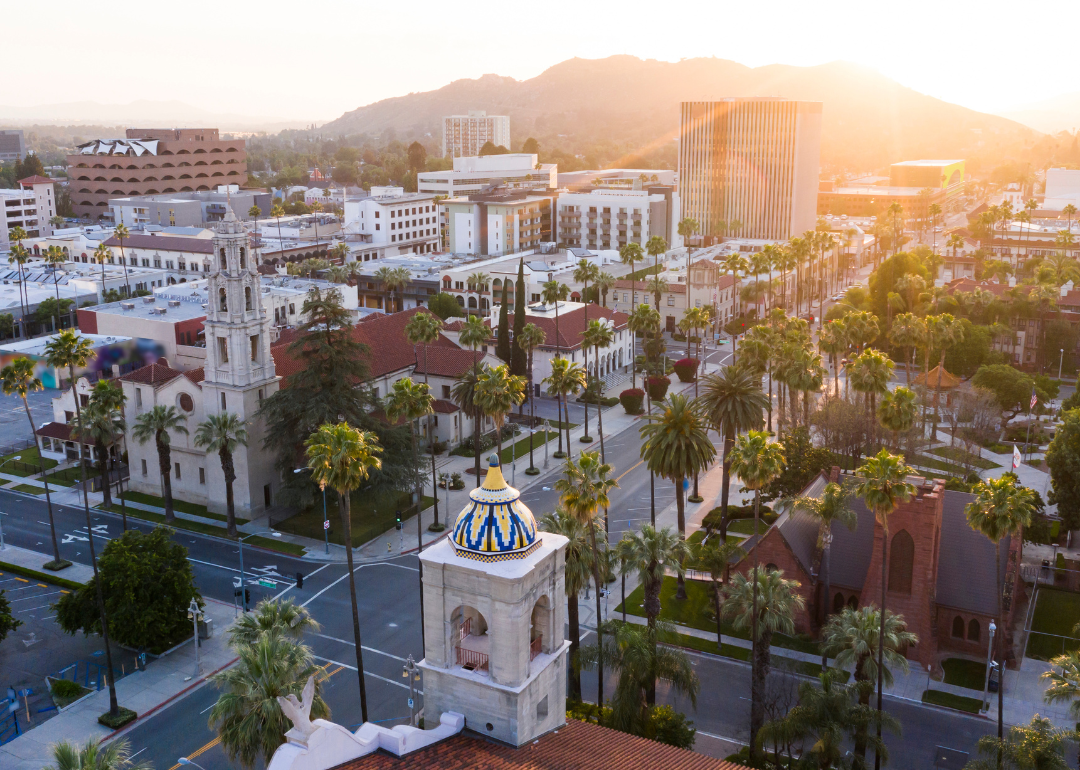
#33. Riverside County
– May unemployment rate (preliminary): 4.4%
— 1-month change: Up 0.2 percentage points
— 1-year change: Up 1.0 percentage points
– Total labor force: 1.1 million people (50,163 unemployed)
Canva
#32. Mariposa County
– May unemployment rate (preliminary): 4.5%
— 1-month change: Down 0.6 percentage points
— 1-year change: Up 1.0 percentage points
– Total labor force: 7,602 people (344 unemployed)

Canva
#31. Sierra County
– May unemployment rate (preliminary): 4.6%
— 1-month change: Down 1.2 percentage points
— 1-year change: Up 1.2 percentage points
– Total labor force: 1,315 people (60 unemployed)
Canva
#30. Lassen County
– May unemployment rate (preliminary): 4.6%
— 1-month change: Down 0.5 percentage points
— 1-year change: Up 1.1 percentage points
– Total labor force: 8,810 people (409 unemployed)

Canva
#29. Amador County
– May unemployment rate (preliminary): 4.8%
— 1-month change: Down 0.1 percentage points
— 1-year change: Up 1.2 percentage points
– Total labor force: 14,307 people (688 unemployed)
StephanieFarrell // Shutterstock
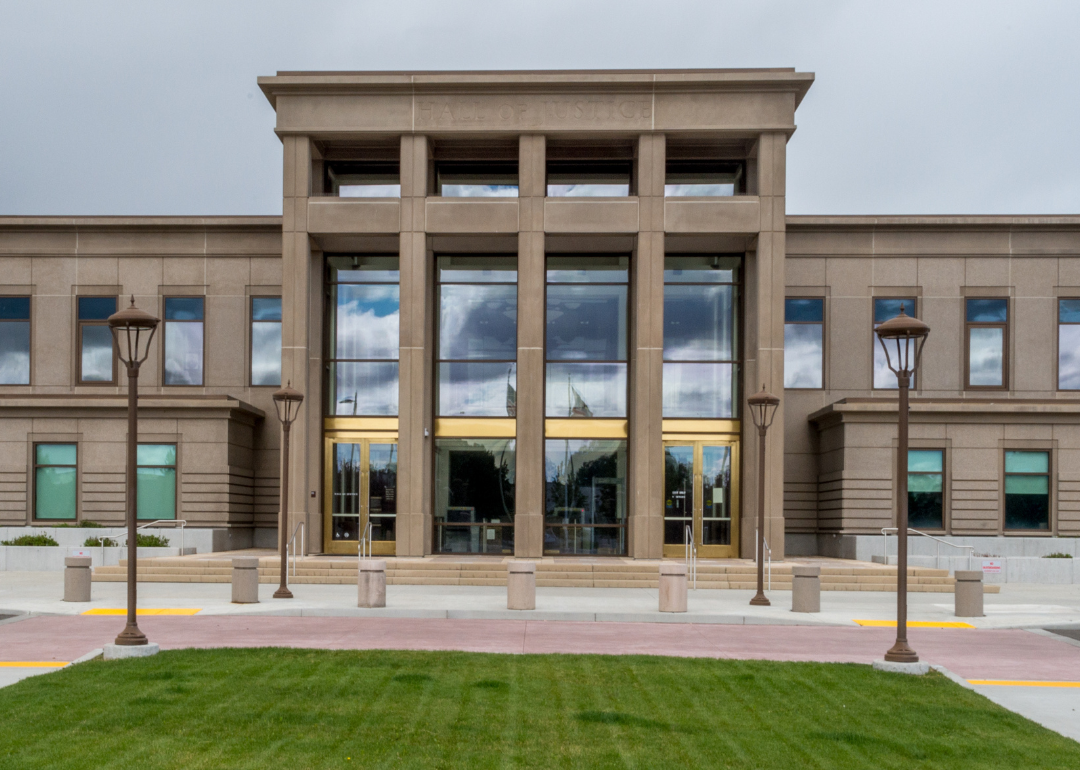
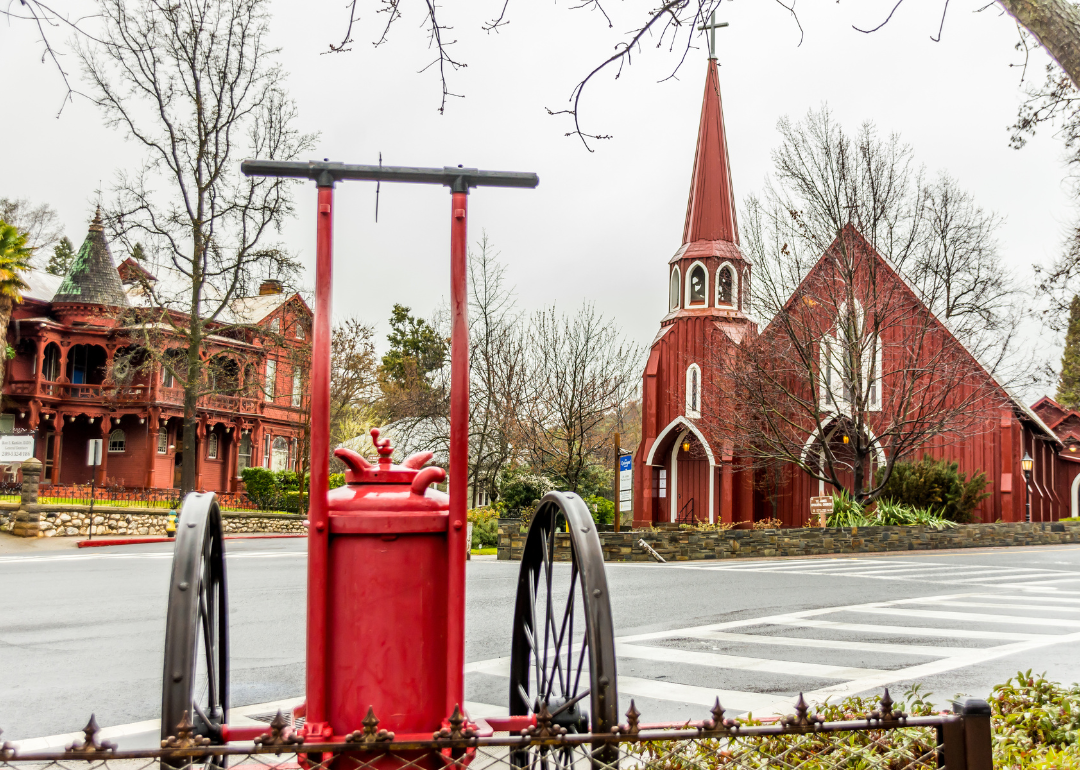
#28. Tuolumne County
– May unemployment rate (preliminary): 4.8%
— 1-month change: Down 0.1 percentage points
— 1-year change: Up 1.0 percentage points
– Total labor force: 19,632 people (933 unemployed)
Canva
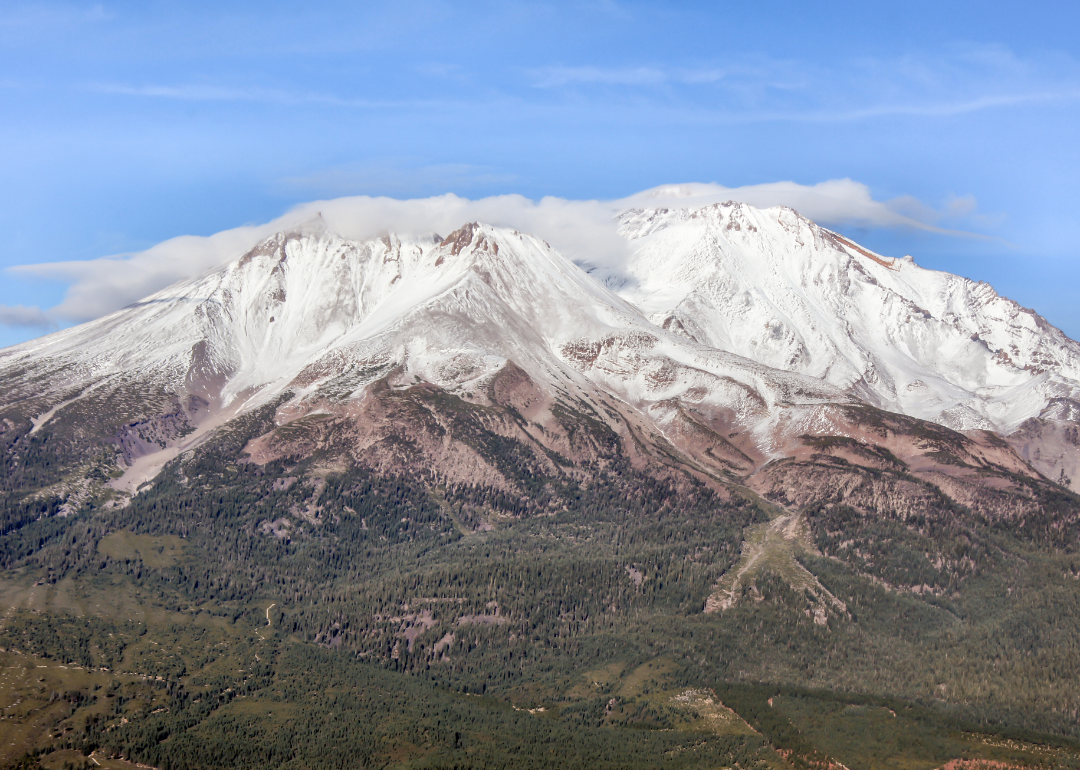
#27. Shasta County
– May unemployment rate (preliminary): 4.8%
— 1-month change: Down 0.2 percentage points
— 1-year change: Up 0.9 percentage points
– Total labor force: 73,437 people (3,559 unemployed)

Canva
#26. Los Angeles County
– May unemployment rate (preliminary): 4.8%
— 1-month change: Up 0.3 percentage points
— 1-year change: Up 0.3 percentage points
– Total labor force: 5.0 million people (240,925 unemployed)
Canva
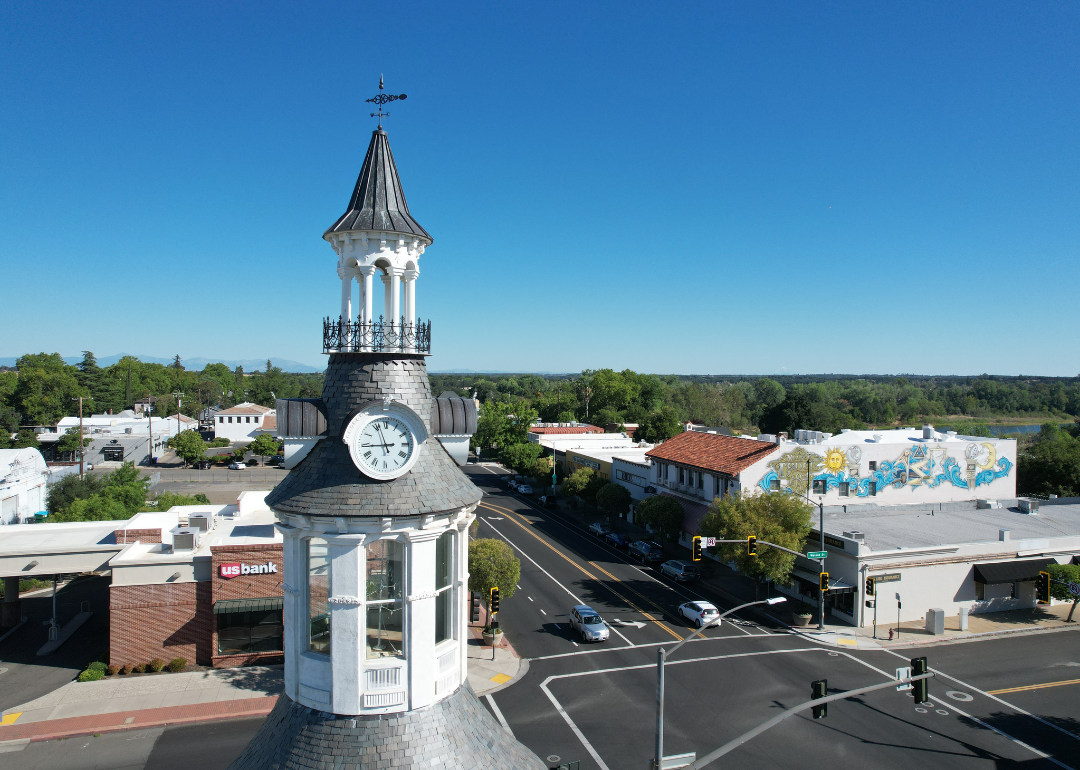
#25. Butte County
– May unemployment rate (preliminary): 4.9%
— 1-month change: No change
— 1-year change: Up 1.2 percentage points
– Total labor force: 92,217 people (4,549 unemployed)

Gibson Outdoor Photo // Shutterstock
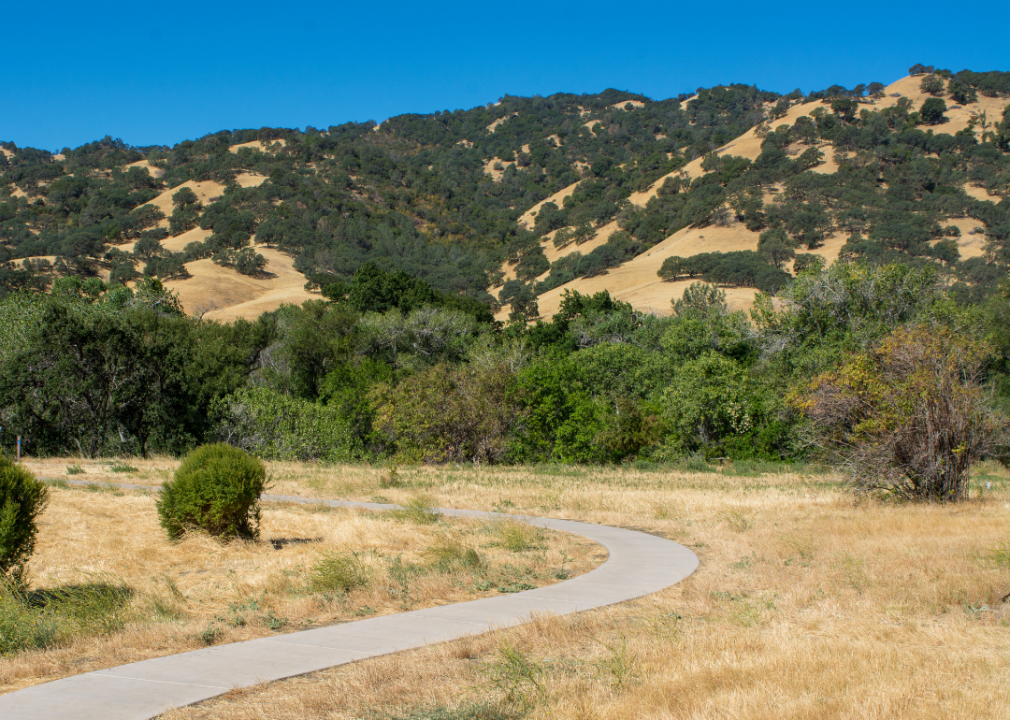
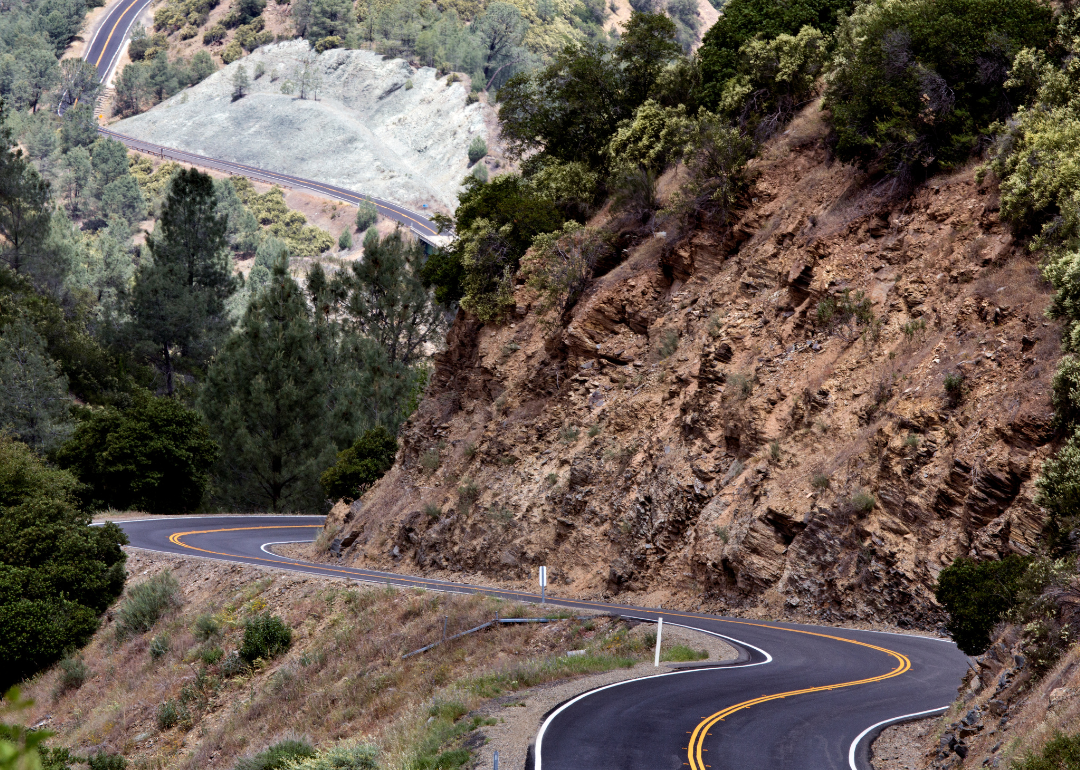
#24. Trinity County
– May unemployment rate (preliminary): 5.5%
— 1-month change: Down 0.5 percentage points
— 1-year change: Up 1.9 percentage points
– Total labor force: 4,433 people (244 unemployed)

Canva
#23. Lake County
– May unemployment rate (preliminary): 5.5%
— 1-month change: Up 0.1 percentage points
— 1-year change: Up 1.5 percentage points
– Total labor force: 28,028 people (1,545 unemployed)

Canva
#22. Del Norte County
– May unemployment rate (preliminary): 5.7%
— 1-month change: Up 0.2 percentage points
— 1-year change: Up 1.1 percentage points
– Total labor force: 9,202 people (524 unemployed)
Canva
#21. Tehama County
– May unemployment rate (preliminary): 5.7%
— 1-month change: Down 0.1 percentage points
— 1-year change: Up 1.6 percentage points
– Total labor force: 25,270 people (1,448 unemployed)

Canva
#20. Santa Cruz County
– May unemployment rate (preliminary): 5.7%
— 1-month change: Down 0.3 percentage points
— 1-year change: Up 1.6 percentage points
– Total labor force: 135,690 people (7,764 unemployed)
Canva
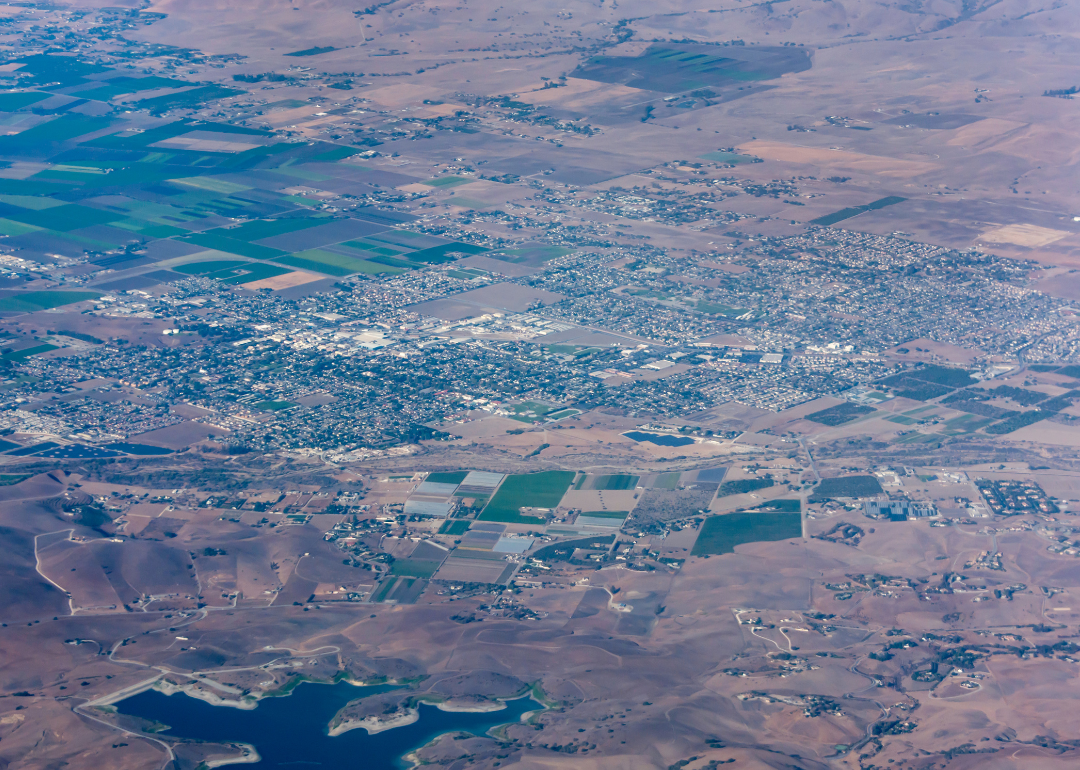
#19. San Benito County
– May unemployment rate (preliminary): 5.8%
— 1-month change: No change
— 1-year change: Up 1.3 percentage points
– Total labor force: 32,625 people (1,908 unemployed)
Canva
#18. Siskiyou County
– May unemployment rate (preliminary): 5.9%
— 1-month change: Down 0.4 percentage points
— 1-year change: Up 1.2 percentage points
– Total labor force: 16,476 people (975 unemployed)

Canva
#17. San Joaquin County
– May unemployment rate (preliminary): 5.9%
— 1-month change: Up 0.1 percentage points
— 1-year change: Up 1.5 percentage points
– Total labor force: 351,816 people (20,683 unemployed)
Canva
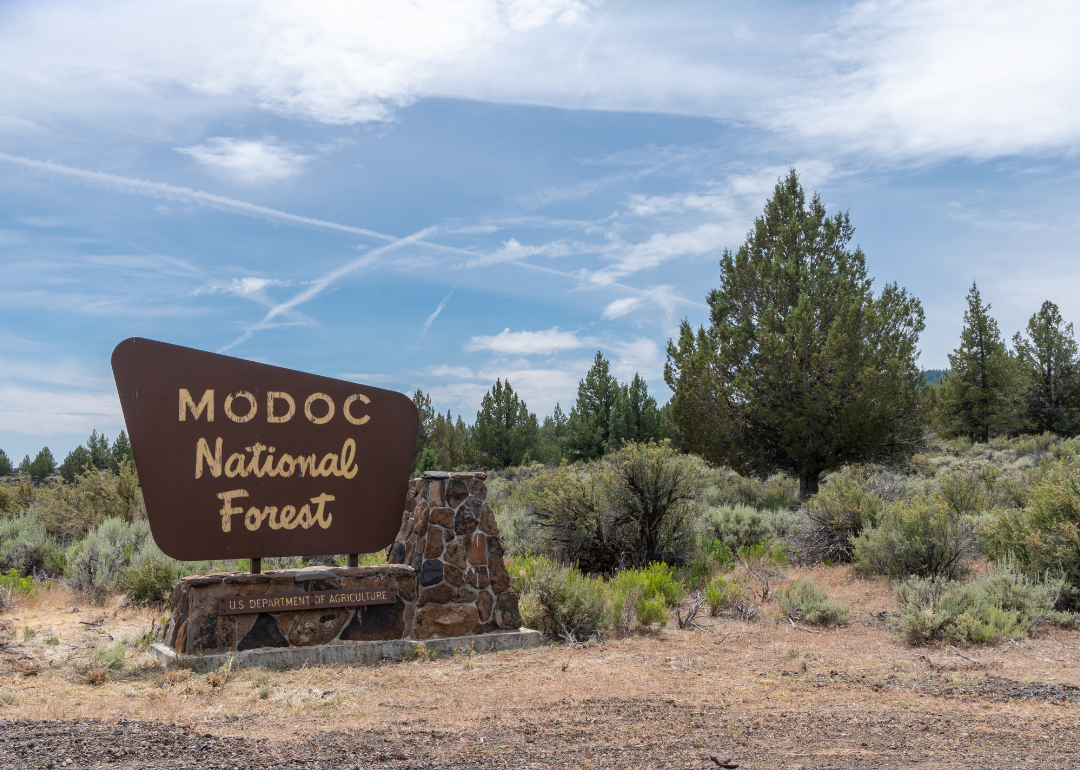
#16. Modoc County
– May unemployment rate (preliminary): 6%
— 1-month change: Down 0.9 percentage points
— 1-year change: Up 1.8 percentage points
– Total labor force: 3,216 people (192 unemployed)

Canva
#15. Yuba County
– May unemployment rate (preliminary): 6.2%
— 1-month change: Down 0.2 percentage points
— 1-year change: Up 1.6 percentage points
– Total labor force: 32,242 people (2,008 unemployed)
CL Shebley // Shutterstock
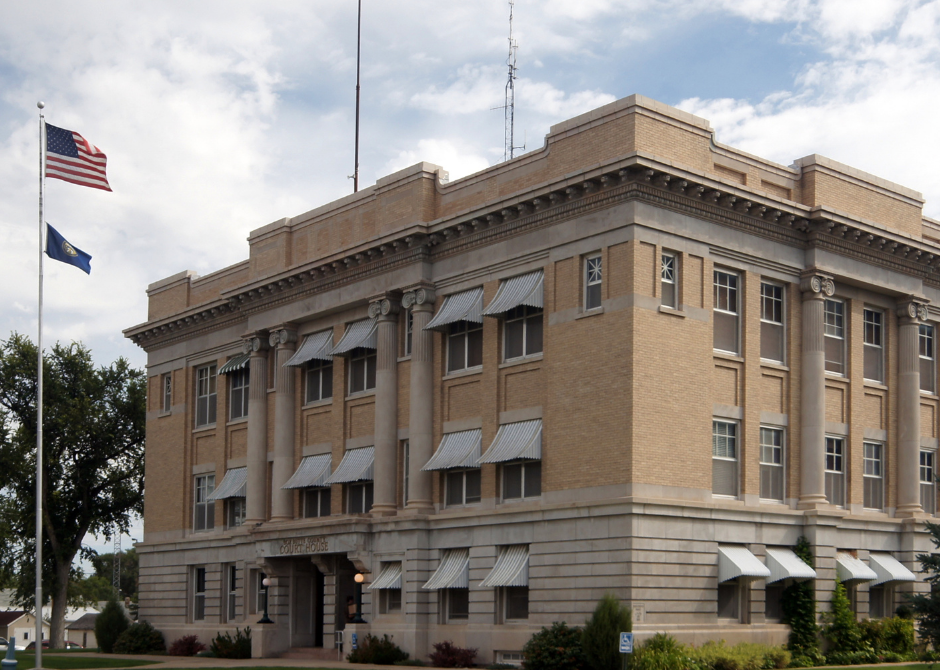
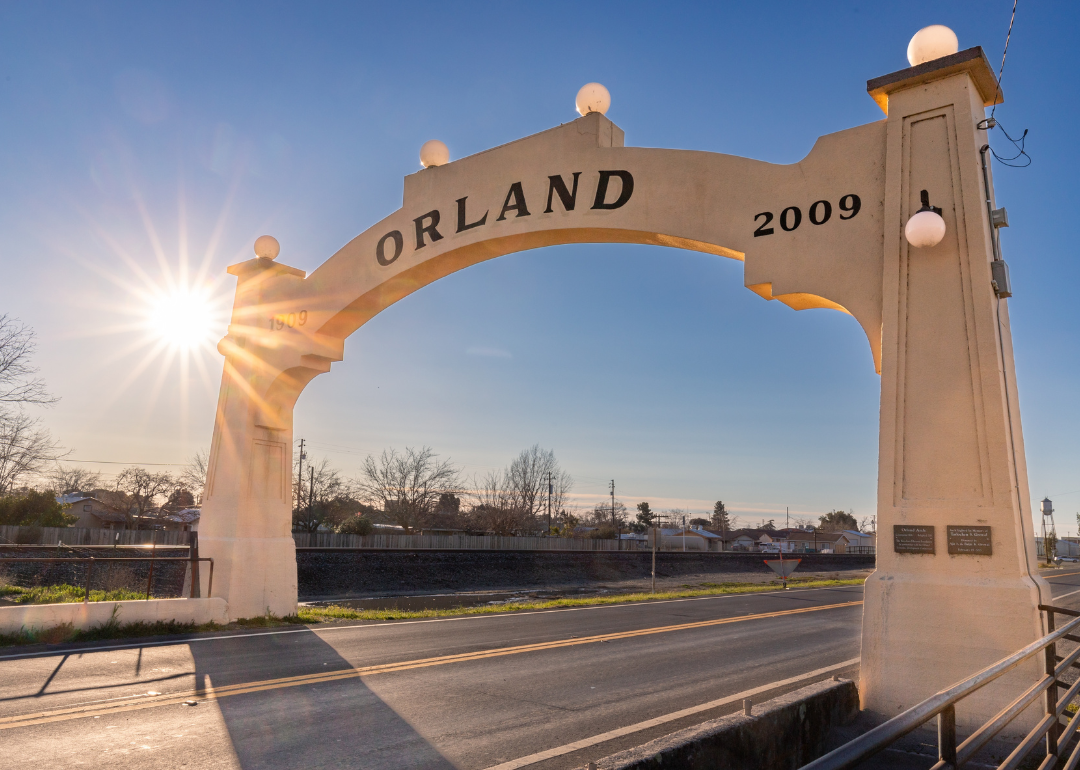
#14. Glenn County
– May unemployment rate (preliminary): 6.3%
— 1-month change: Up 0.1 percentage points
— 1-year change: Up 1.6 percentage points
– Total labor force: 12,615 people (799 unemployed)

Canva
#13. Monterey County
– May unemployment rate (preliminary): 6.3%
— 1-month change: Down 1.1 percentage points
— 1-year change: Up 1.6 percentage points
– Total labor force: 236,678 people (14,878 unemployed)

Canva
#12. Stanislaus County
– May unemployment rate (preliminary): 6.4%
— 1-month change: Up 0.2 percentage points
— 1-year change: Up 1.6 percentage points
– Total labor force: 245,796 people (15,613 unemployed)
Canva
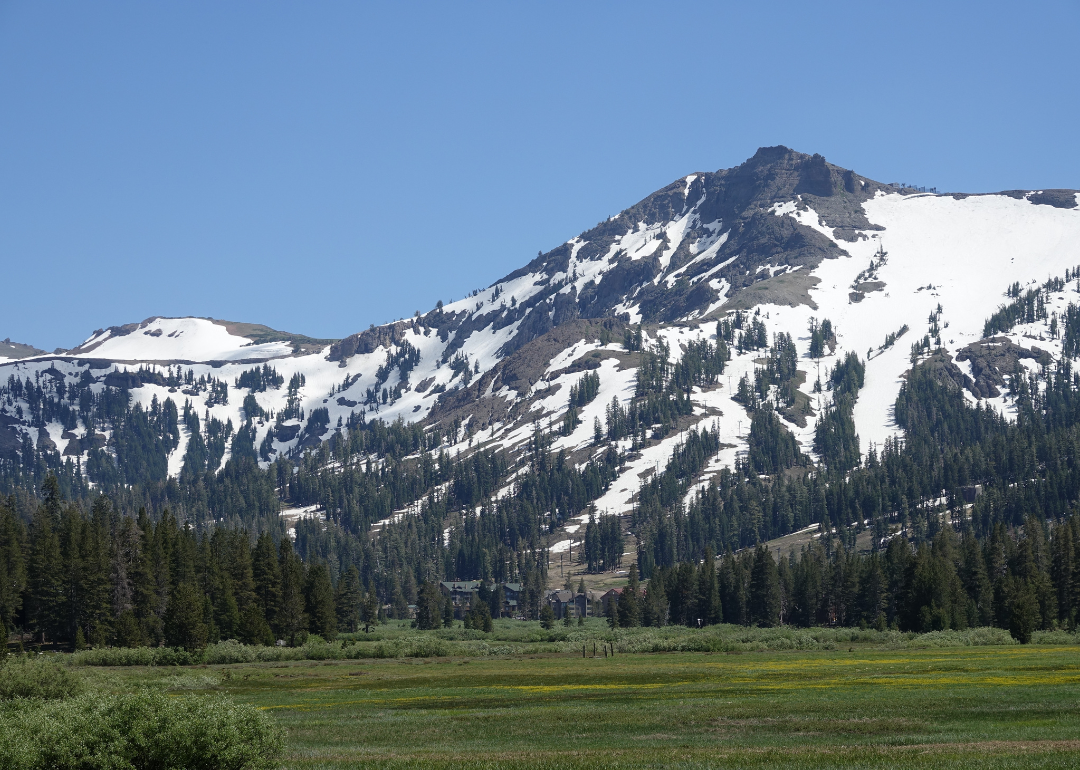
#11. Alpine County
– May unemployment rate (preliminary): 6.9%
— 1-month change: Up 1.2 percentage points
— 1-year change: Up 1.2 percentage points
– Total labor force: 490 people (34 unemployed)

Canva
#10. Plumas County
– May unemployment rate (preliminary): 6.9%
— 1-month change: Down 1.9 percentage points
— 1-year change: Up 2.0 percentage points
– Total labor force: 7,376 people (509 unemployed)

Canva
#9. Madera County
– May unemployment rate (preliminary): 7.3%
— 1-month change: Down 0.4 percentage points
— 1-year change: Up 1.9 percentage points
– Total labor force: 65,763 people (4,826 unemployed)
Canva
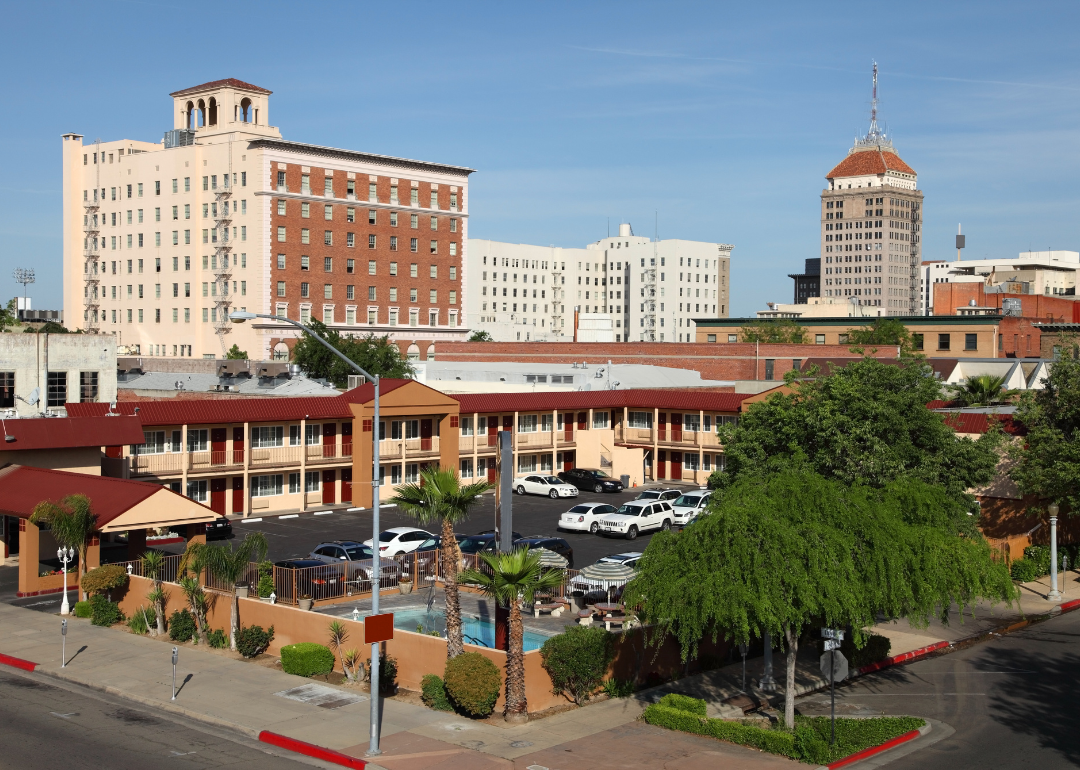
#8. Fresno County
– May unemployment rate (preliminary): 7.5%
— 1-month change: No change
— 1-year change: Up 1.9 percentage points
– Total labor force: 465,577 people (34,842 unemployed)
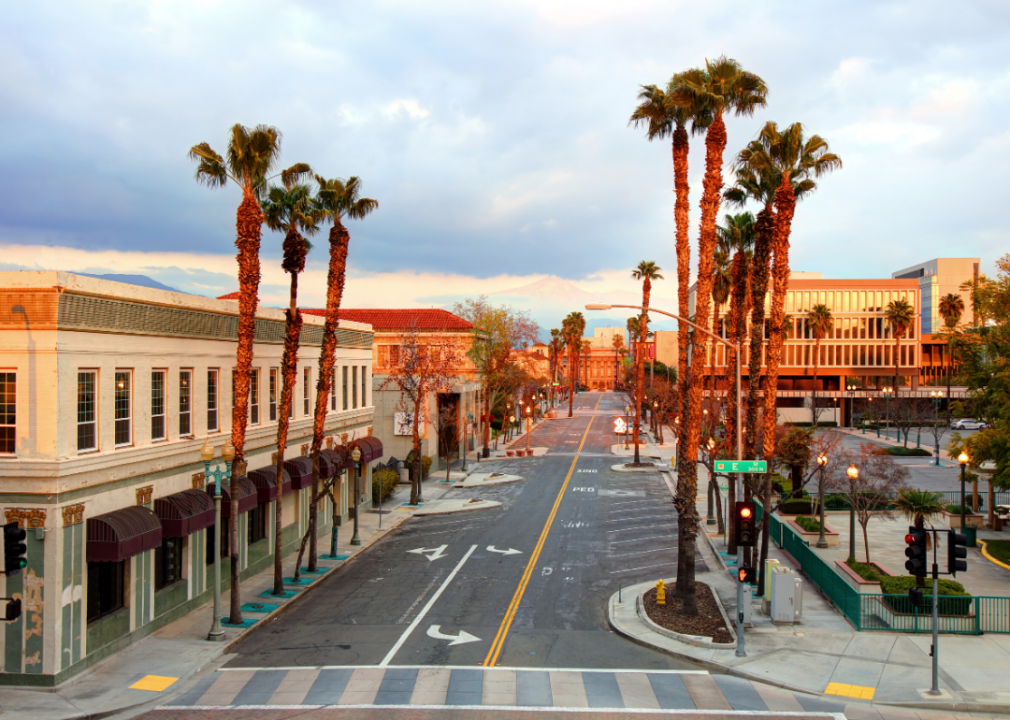
Matt Gush // Shutterstock
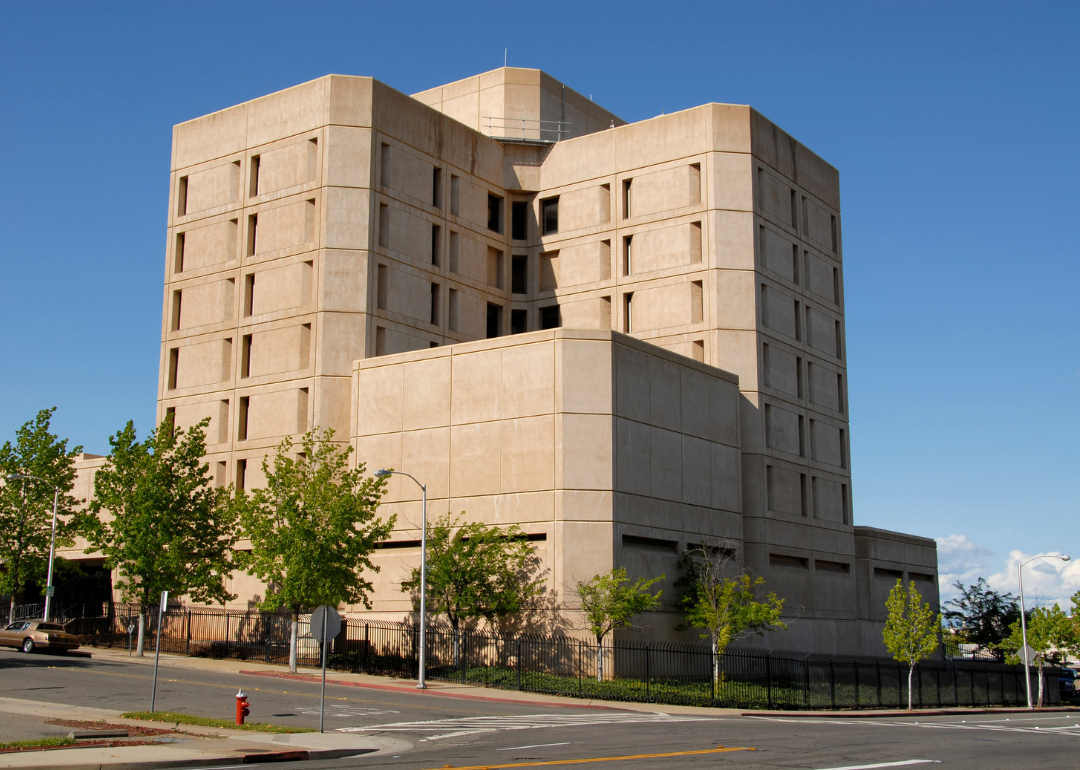
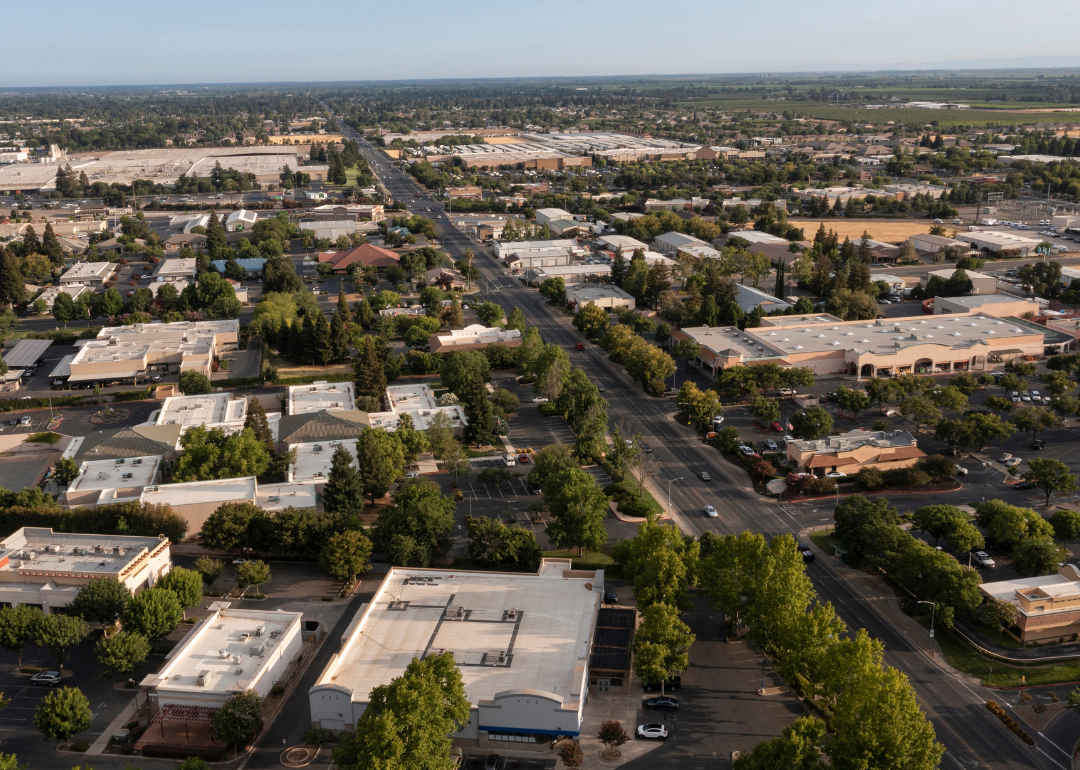
#7. Sutter County
– May unemployment rate (preliminary): 7.9%
— 1-month change: Down 0.3 percentage points
— 1-year change: Up 2.0 percentage points
– Total labor force: 47,768 people (3,792 unemployed)
Canva
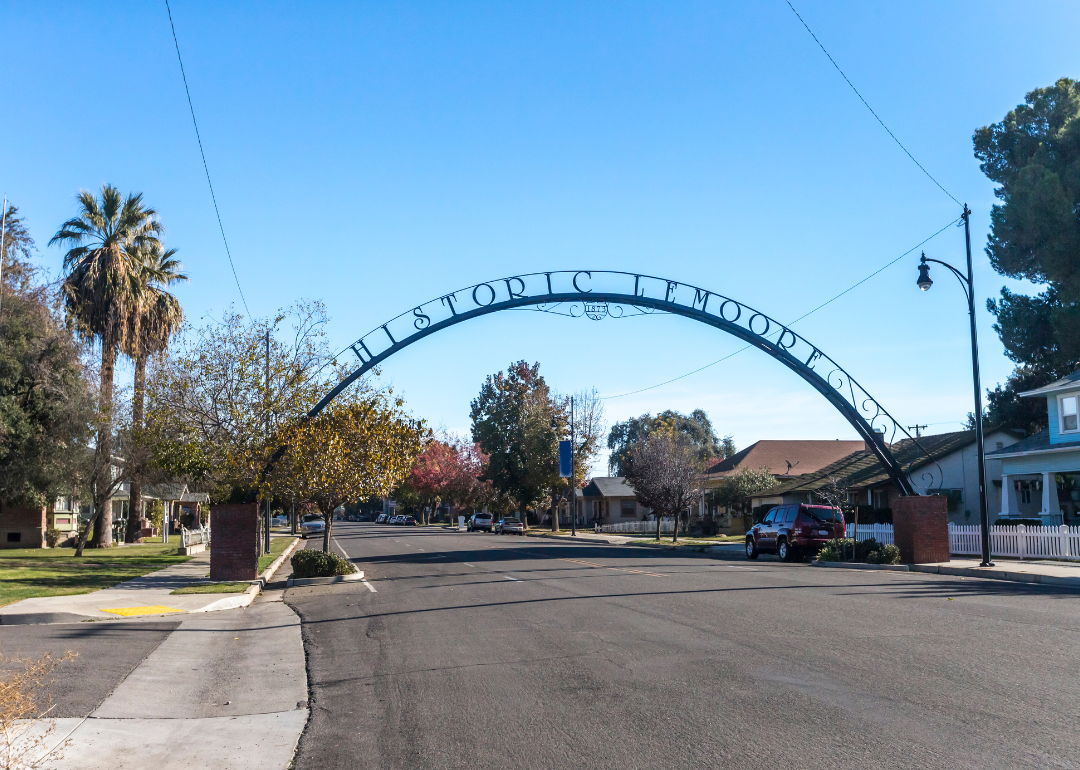
#6. Kings County
– May unemployment rate (preliminary): 8%
— 1-month change: Down 0.3 percentage points
— 1-year change: Up 1.8 percentage points
– Total labor force: 58,507 people (4,663 unemployed)
Canva
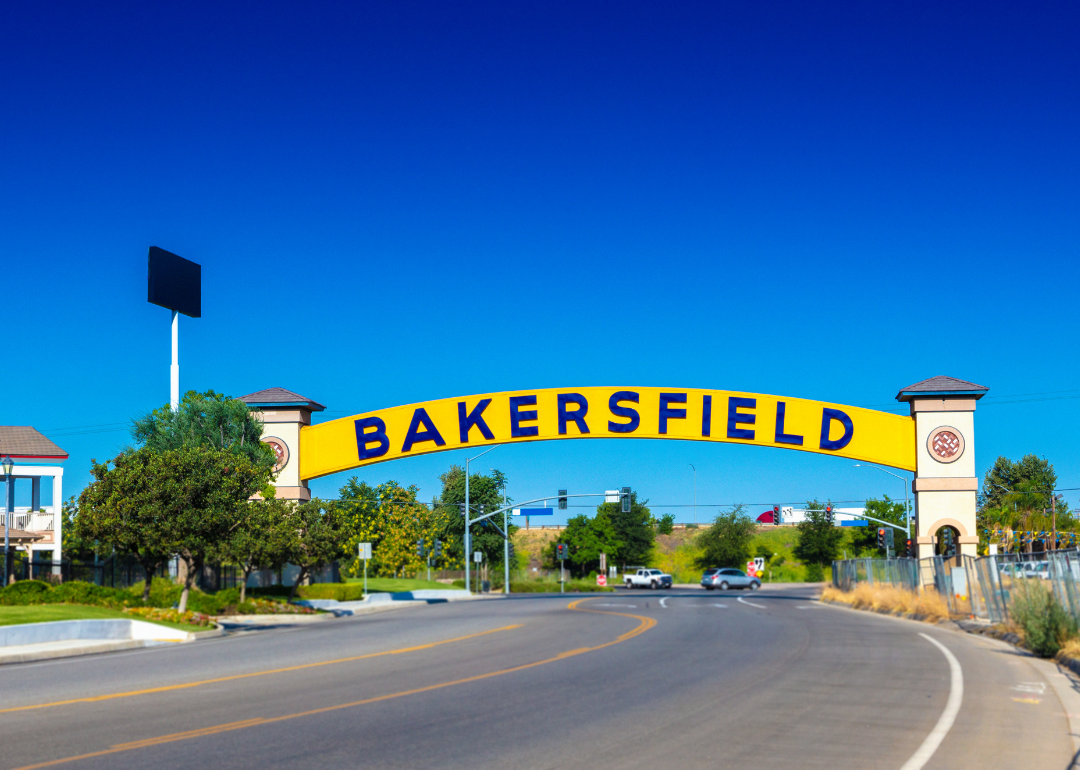
#5. Kern County
– May unemployment rate (preliminary): 8.6%
— 1-month change: Up 0.3 percentage points
— 1-year change: Up 2.1 percentage points
– Total labor force: 397,202 people (34,156 unemployed)

Canva
#4. Merced County
– May unemployment rate (preliminary): 9.3%
— 1-month change: Down 0.5 percentage points
— 1-year change: Up 2.3 percentage points
– Total labor force: 116,650 people (10,802 unemployed)
Canva
#3. Tulare County
– May unemployment rate (preliminary): 10%
— 1-month change: Up 0.2 percentage points
— 1-year change: Up 3.0 percentage points
– Total labor force: 216,327 people (21,577 unemployed)

Canva
#2. Colusa County
– May unemployment rate (preliminary): 13.5%
— 1-month change: Down 1.4 percentage points
— 1-year change: Up 3.0 percentage points
– Total labor force: 10,290 people (1,385 unemployed)
Canva
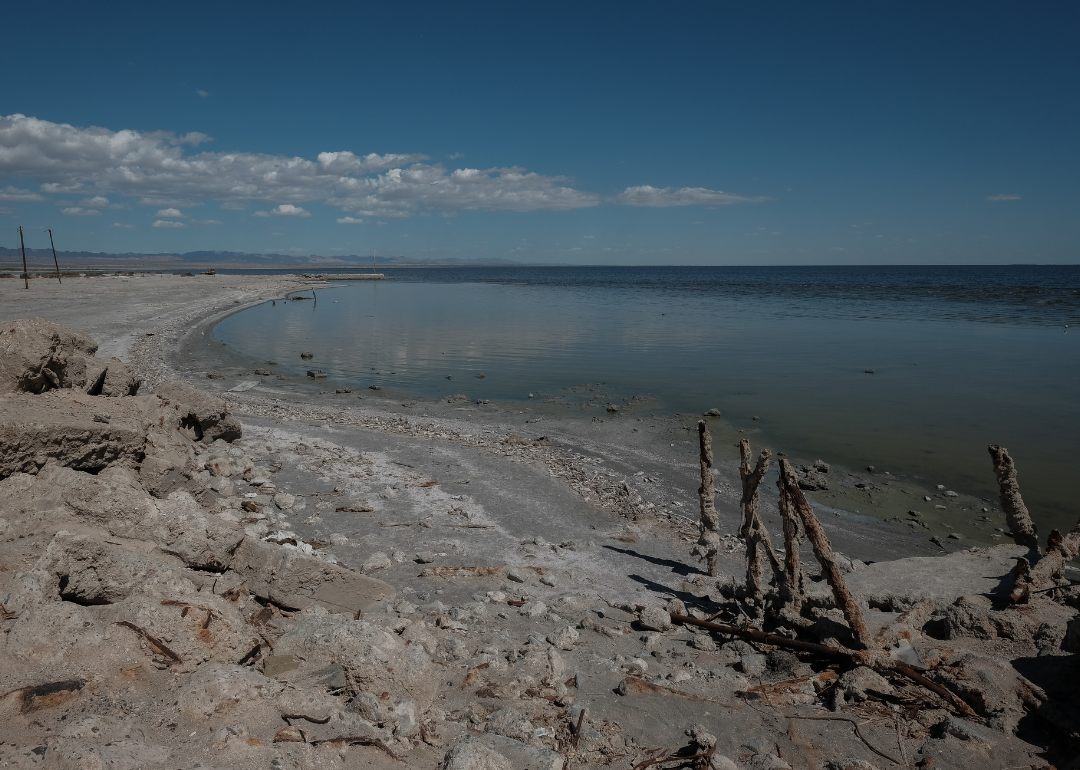
#1. Imperial County
– May unemployment rate (preliminary): 16%
— 1-month change: Up 1.8 percentage points
— 1-year change: Up 3.7 percentage points
– Total labor force: 70,768 people (11,324 unemployed)