Best public high schools in America
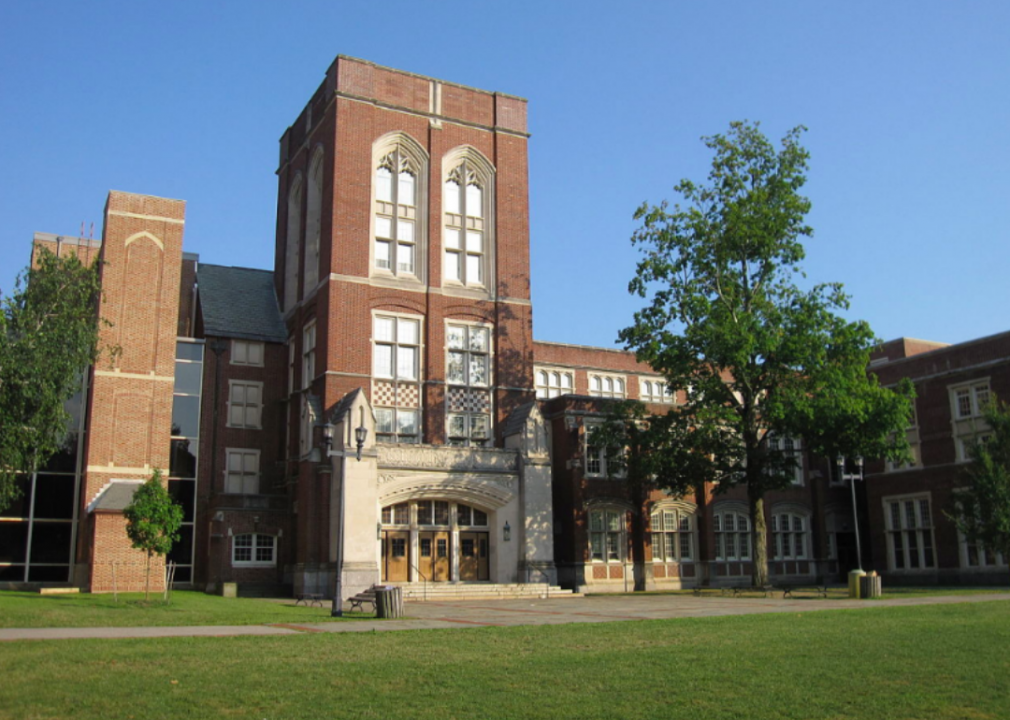
Jweiss11 // Wikimedia Commons
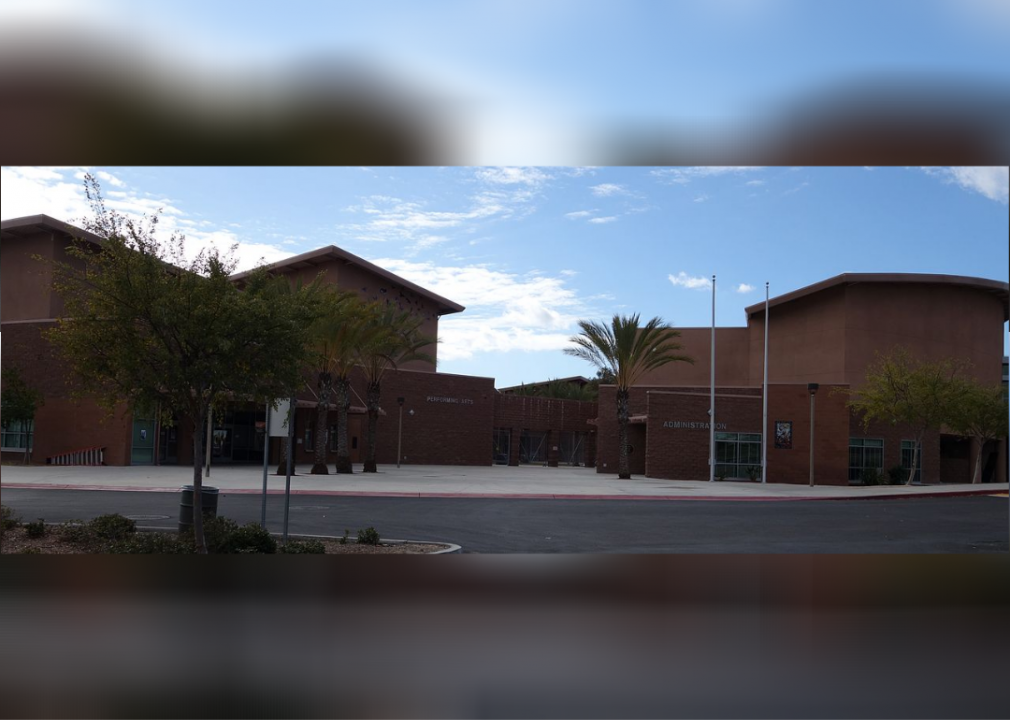
Best public high schools in America
As filmmaker and writer Nora Ephron said during a ’96 commencement address at Wellesley College, “Your education is a dress rehearsal for a life that is yours to lead.” If that’s the case, high school may be one of the greatest dress rehearsals of all.
It’s a place where students explore their interests, dive into extracurricular activities, finally get the freedom to choose their own classes, and prepare for college or the workplace. For many of these students and their families, public education is key: 48.1 million students enrolled in public elementary and secondary schools in 2020; and there are almost 24,000 public high schools in the U.S., according to the National Center for Education Statistics.
For many anxious parents, getting their kid into the best of these public high schools is of the utmost importance. Some families even move homes to get into better school districts. However, among all of these thousands of schools, a few stand out for their academic excellence, incredible track records, and the future success of their young students.
Find out how the 100 best public high schools in the country stack up against each other. This Stacker ranking is derived from Niche’s list of the best public high schools, updated in January 2021, which they base on statistics, reviews, and other data from the U.S. Department of Education. Here’s how it breaks down: Niche uses eight factors for its rankings, with each factor given a different weight. A whopping 60% of the score is based on academics and grades, which is calculated using state assessment proficiency tests, SAT/ACT scores, and survey responses. From there, culture and diversity, parent and student surveys on their overall experiences, and teachers each contribute to 10% of the score. Finally, scores for each school’s clubs and activities, health and safety, resources and facilities, and sports constitute 2.5% each.
Keep reading to find out which public high schools are determined to be the best in the nation.
You may also like: The best school district in every state
![]()

Canva
#100. Tenafly High School
– Location: Tenafly, NJ
– Grades offered: 9-12
– Students: 1,226 (49% female; 51% male)
– Racial composition: 60.0% White; 30.5% Asian; 5.6% Hispanic; 2.0% Multiracial
– Student-teacher ratio: 12:1
– Academic achievement:
— Reading proficient: 73%
— Math proficient: 65%
— AP enrollment: 31%

Canva
#99. McLean High School
– Location: McLean, VA
– Grades offered: 9-12
– Students: 2,275 (48% female; 52% male)
– Racial composition: 55.1% White; 24.5% Asian; 11.4% Hispanic; 5.5% Multiracial
– Student-teacher ratio: 17:1
– Academic achievement:
— Reading proficient: 98%
— Math proficient: 93%
— AP enrollment: 46%
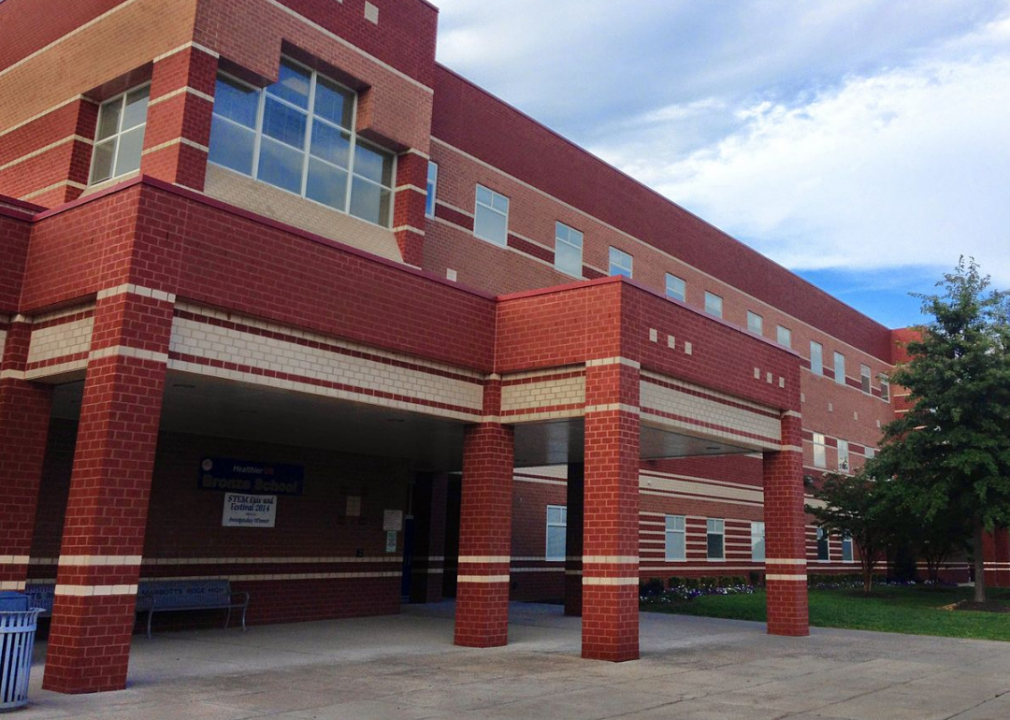
Rocky1380 // Wikimedia Commons
#98. Marriotts Ridge High School
– Location: Marriottsville, MD
– Grades offered: 9-12
– Students: 1,419 (52% female; 48% male)
– Racial composition: 48.2% White; 35.2% Asian; 9.7% Black; 3.9% Multiracial
– Student-teacher ratio: 16:1
– Academic achievement:
— Reading proficient: 67%
— Math proficient: 97%
— AP enrollment: 48%

Canva
#97. Northview High School
– Location: Duluth, GA
– Grades offered: 9-12
– Students: 1,778 (48% female; 52% male)
– Racial composition: 53.3% Asian; 25.2% White; 13.4% Black; 4.6% Hispanic
– Student-teacher ratio: 18:1
– Academic achievement:
— Reading proficient: 78%
— Math proficient: 84%
— AP enrollment: 49%

KazT // Shutterstock
#96. Baccalaureate School for Global Education
– Location: Long Island City, NY
– Grades offered: 7-12
– Students: 536 (60% female; 40% male)
– Racial composition: 46.1% Asian; 26.9% White; 18.8% Hispanic; 3.9% Black
– Student-teacher ratio: 18:1
– Academic achievement:
— Reading proficient: 99%
— Math proficient: 97%
— AP enrollment: unavailable
[Pictured: Long Island City, NY.]
You may also like: Best county to retire in every state
Foursquare
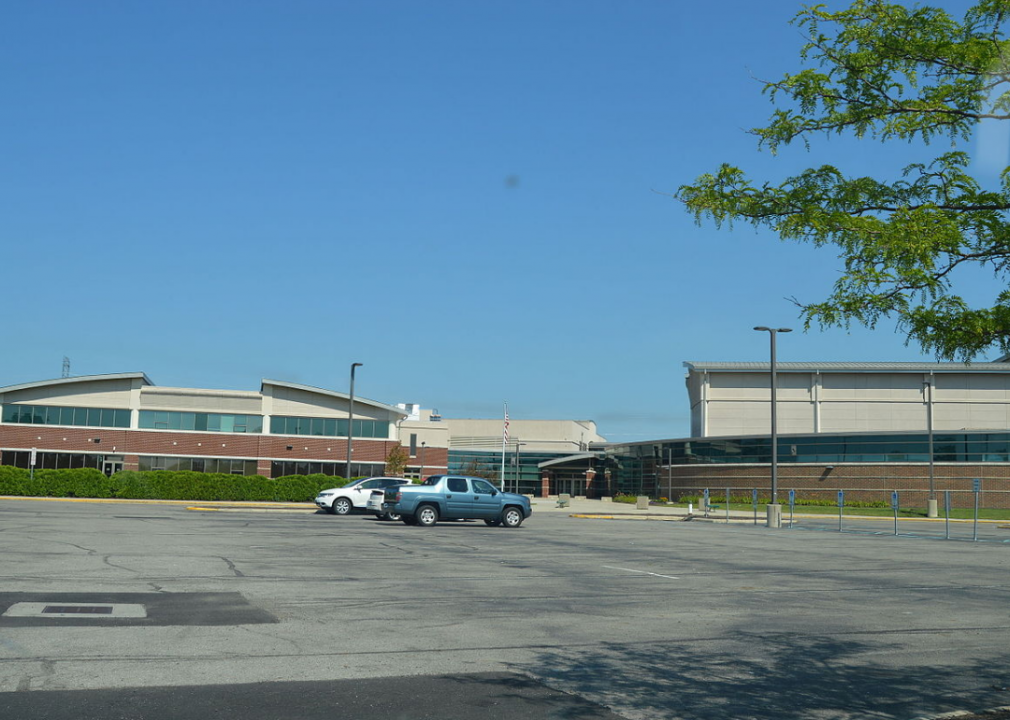
#95. Troy High School
– Location: Troy, MI
– Grades offered: 9-12
– Students: 2,050 (50% female; 50% male)
– Racial composition: 47.7% White; 40.7% Asian; 4.2% Black; 3.8% Hispanic
– Student-teacher ratio: 19:1
– Academic achievement:
— Reading proficient: 84%
— Math proficient: 73%
— AP enrollment: 40%
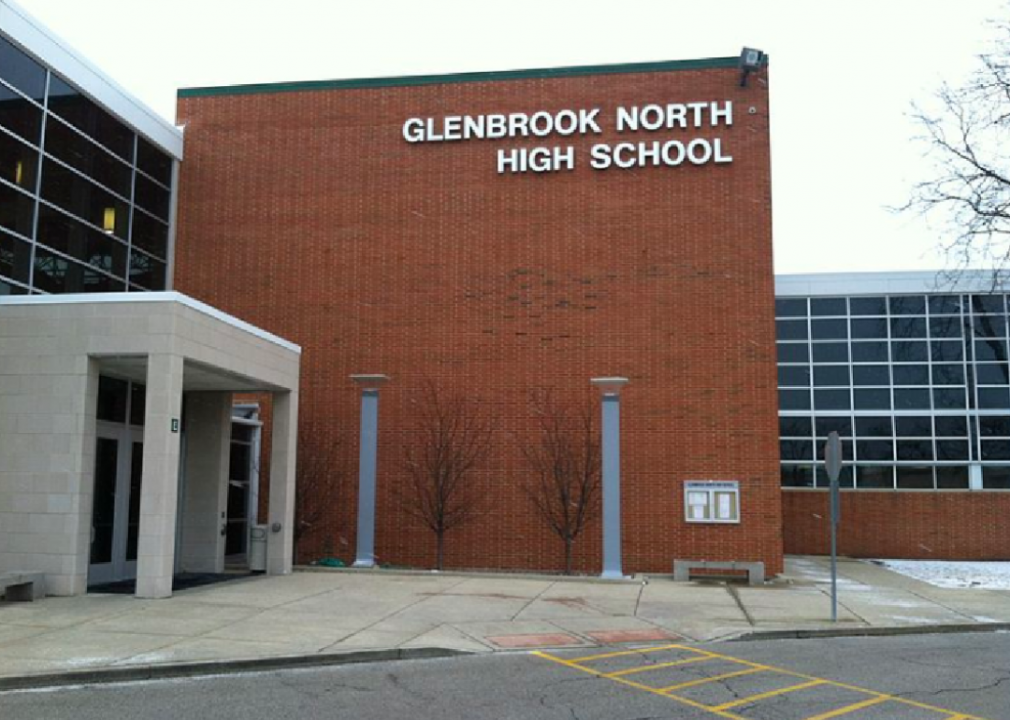
Dustin Batt // Wikimedia Commons
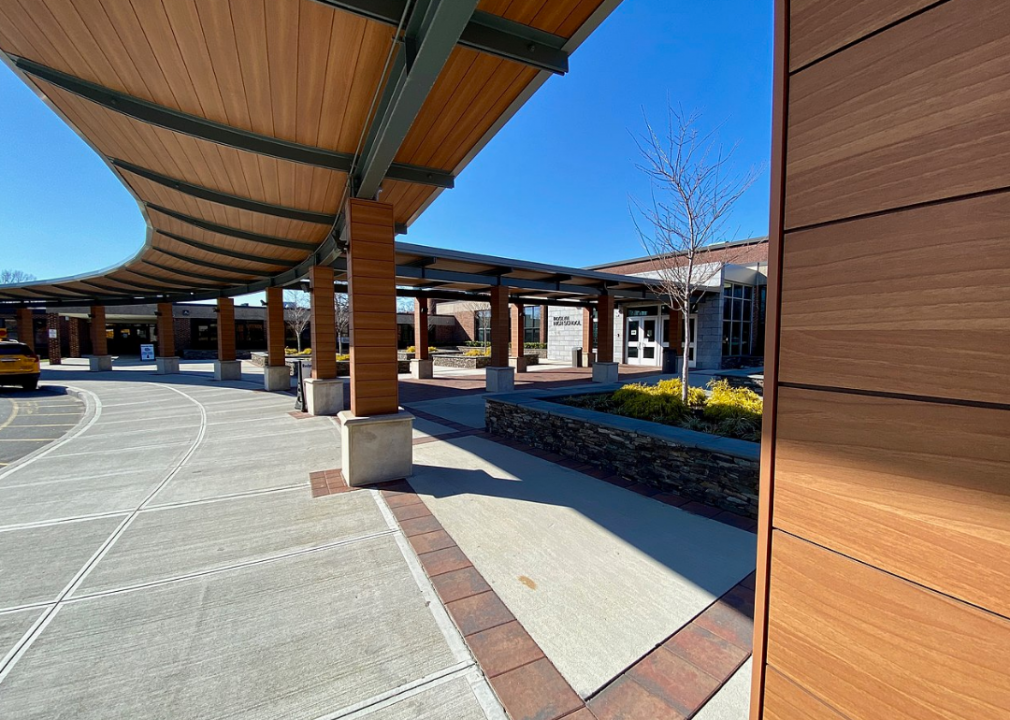
#94. Glenbrook North High School
– Location: Northbrook, IL
– Grades offered: 9-12
– Students: 1,988 (49% female; 51% male)
– Racial composition: 75.0% White; 15.0% Asian; 4.8% Hispanic; 4.3% Multiracial
– Student-teacher ratio: 18:1
– Academic achievement:
— Reading proficient: 76%
— Math proficient: 76%
— AP enrollment: 25%
Foursquare
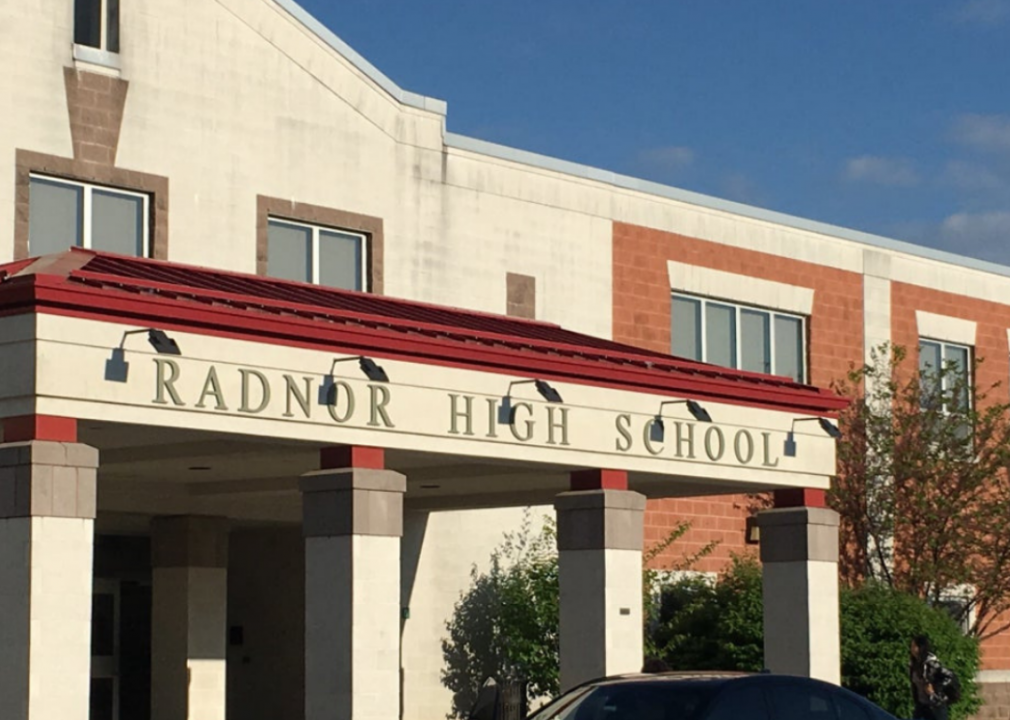
#93. Radnor Senior High School
– Location: Radnor, PA
– Grades offered: 9-12
– Students: 1,219 (49% female; 51% male)
– Racial composition: 73.2% White; 15.0% Asian; 6.8% Black; 4.4% Hispanic
– Student-teacher ratio: 14:1
– Academic achievement:
— Reading proficient: 91%
— Math proficient: 91%
— AP enrollment: 83%

Canva
#92. Carmel High School
– Location: Carmel, CA
– Grades offered: 9-12
– Students: 845 (50% female; 50% male)
– Racial composition: 60.6% White; 18.8% Hispanic; 14.1% Multiracial; 5.2% Asian
– Student-teacher ratio: 16:1
– Academic achievement:
— Reading proficient: 82%
— Math proficient: 67%
— AP enrollment: 51%
Leo Hernandez // Flickr
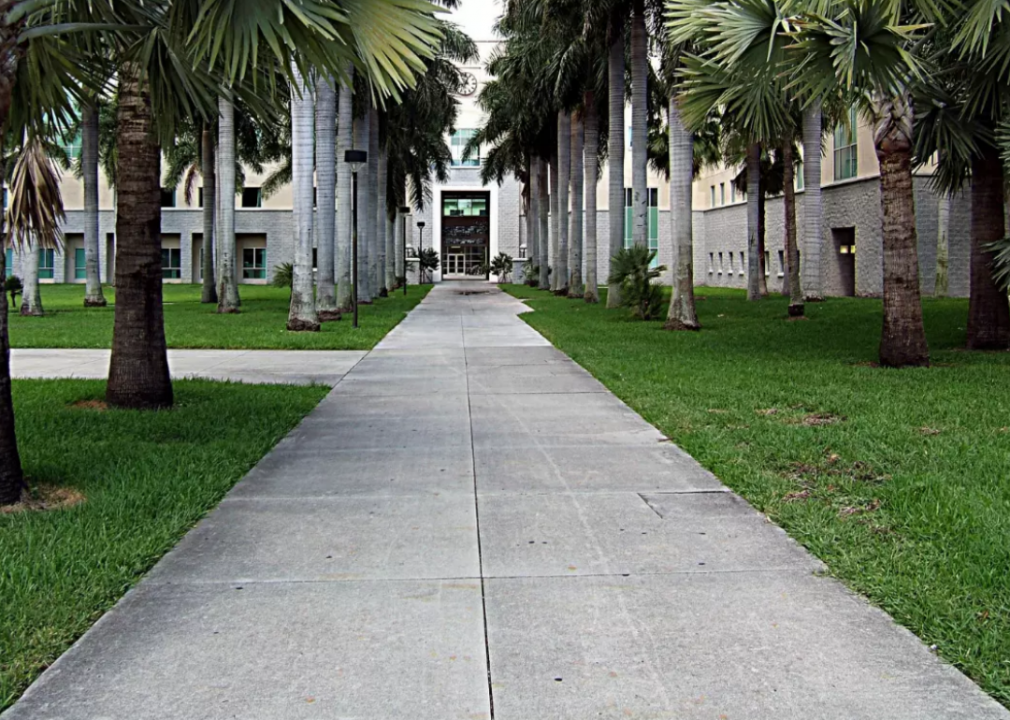
#91. A.D. Henderson University School & FAU High School
– Location: Boca Raton, FL
– Grades offered: K-12
– Students: 1,148 (52% female; 48% male)
– Racial composition: 43.4% White; 26.7% Hispanic; 14.9% Black; 10.0% Asian
– Student-teacher ratio: 26:1
– Academic achievement:
— Reading proficient: 90%
— Math proficient: 89%
— AP enrollment: unavailable
You may also like: 50 best colleges in the Midwest

Canva
#90. Orange County School of the Arts
– Location: Santa Ana, CA
– Grades offered: 7-12
– Students: 2,177 (68% female; 32% male)
– Racial composition: 40.8% White; 22.6% Asian; 20.6% Hispanic; 14.6% Multiracial
– Student-teacher ratio: 29:1
– Academic achievement:
— Reading proficient: 89%
— Math proficient: 78%
— AP enrollment: 54%
Mschwartz20 // Wikimedia Commons
#89. Roslyn High School
– Location: Roslyn Heights, NY
– Grades offered: 9-12
– Students: 1,043 (48% female; 52% male)
– Racial composition: 70.5% White; 18.0% Asian; 7.8% Hispanic; 3.0% Black
– Student-teacher ratio: 13:1
– Academic achievement:
— Reading proficient: 99%
— Math proficient: 95%
— AP enrollment: 48%
Sesamehoneytart // Wikimedia Commons
#88. Dublin Jerome High School
– Location: Dublin, OH
– Grades offered: 9-12
– Students: 1,794 (48% female; 52% male)
– Racial composition: 69.0% White; 23.4% Asian; 4.0% Multiracial; 2.2% Hispanic
– Student-teacher ratio: 21:1
– Academic achievement:
— Reading proficient: 89%
— Math proficient: 84%
— AP enrollment: 40%
Lincoln Beddoe // Shutterstock
#87. BASIS Ahwatukee
– Location: Phoenix, AZ
– Grades offered: 4-12
– Students: 763 (50% female; 50% male)
– Racial composition: 51.0% Asian; 30.1% White; 9.2% Hispanic; 5.2% Black
– Student-teacher ratio: 23.5:1
– Academic achievement:
— Reading proficient: 82%
— Math proficient: 91%
— AP enrollment: 100%

Canva
#86. Clayton High School
– Location: Clayton, MO
– Grades offered: 9-12
– Students: 900 (48% female; 52% male)
– Racial composition: 61.3% White; 18.0% Black; 12.1% Asian; 4.3% Hispanic
– Student-teacher ratio: 12:1
– Academic achievement:
— Reading proficient: 80%
— Math proficient: 78%
— AP enrollment: 33%
You may also like: 50 women who broke barriers in the business world
Eden, Janine and Jim // Flickr
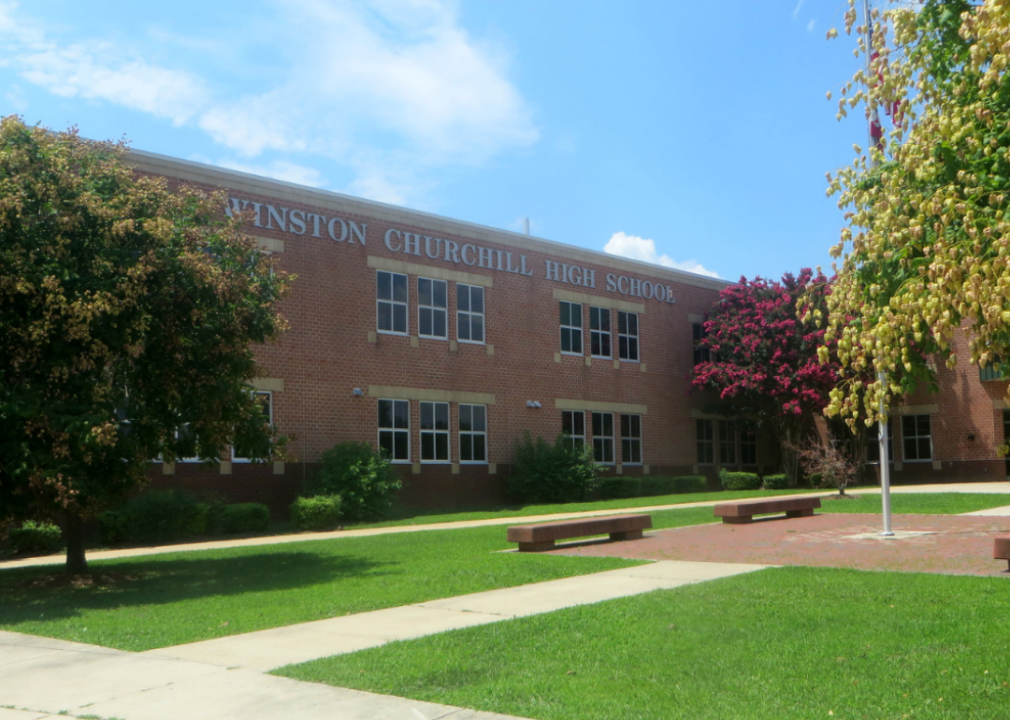
#85. Winston Churchill High School
– Location: Potomac, MD
– Grades offered: 9-12
– Students: 2,227 (45% female; 55% male)
– Racial composition: 48.5% White; 28.6% Asian; 9.2% Black; 8.0% Hispanic
– Student-teacher ratio: 18:1
– Academic achievement:
— Reading proficient: 66%
— Math proficient: 94%
— AP enrollment: 64%

Canva
#84. Great Neck North High School
– Location: Great Neck, NY
– Grades offered: 9-12
– Students: 1,172 (49% female; 51% male)
– Racial composition: 70.1% White; 18.9% Asian; 8.4% Hispanic; 1.4% Multiracial
– Student-teacher ratio: 11:1
– Academic achievement:
— Reading proficient: 98%
— Math proficient: 98%
— AP enrollment: 41%

Canva
#83. Carroll Senior High School
– Location: Southlake, TX
– Grades offered: 11-12
– Students: 1,342 (51% female; 49% male)
– Racial composition: 71.3% White; 13.0% Asian; 9.8% Hispanic; 3.7% Multiracial
– Student-teacher ratio: 15:1
– Academic achievement:
— Reading proficient: 99%
— Math proficient: 98%
— AP enrollment: 59%

Canva
#82. Torrey Pines High School
– Location: San Diego, CA
– Grades offered: 9-12
– Students: 2,444 (46% female; 54% male)
– Racial composition: 60.2% White; 21.9% Asian; 13.2% Hispanic; 3.2% Multiracial
– Student-teacher ratio: 26:1
– Academic achievement:
— Reading proficient: 84%
— Math proficient: 69%
— AP enrollment: 74%

smolaw // Shutterstock
#81. BASIS Phoenix
– Location: Phoenix, AZ
– Grades offered: 6-12
– Students: 781 (48% female; 52% male)
– Racial composition: 51.2% White; 38.4% Asian; 6.3% Hispanic; 2.0% Black
– Student-teacher ratio: 18:1
– Academic achievement:
— Reading proficient: 85%
— Math proficient: 90%
— AP enrollment: 93%
You may also like: Ranking the reputation of the 100 most visible companies in America
King of Hearts // Wikimedia Commons
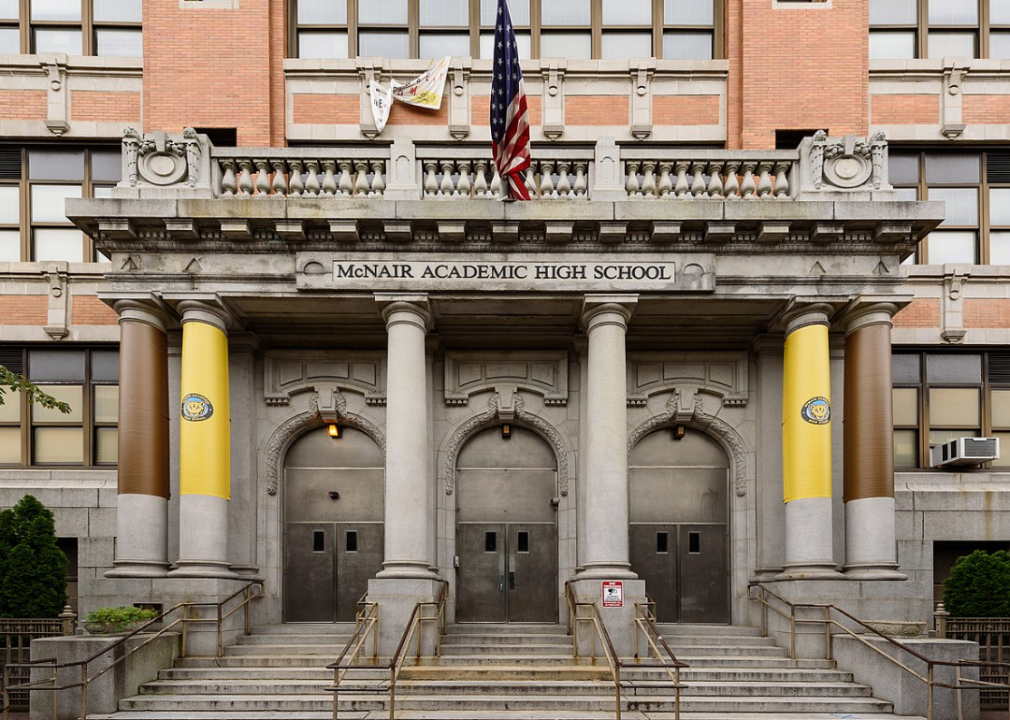
#80. Dr. Ronald E. McNair Academic High School
– Location: Jersey City, NJ
– Grades offered: 9-12
– Students: 699 (54% female; 46% male)
– Racial composition: 45.6% Asian; 19.7% White; 18.5% Hispanic; 13.7% Black
– Student-teacher ratio: 14:1
– Academic achievement:
— Reading proficient: 98%
— Math proficient: 89%
— AP enrollment: 77%
B Brown // Shutterstock
#79. Palos Verdes Peninsula High School
– Location: Rolling Hills Estates, CA
– Grades offered: 9-12
– Students: 2,329 (49% female; 51% male)
– Racial composition: 39.9% Asian; 38.2% White; 11.3% Hispanic; 7.6% Multiracial
– Student-teacher ratio: 24:1
– Academic achievement:
— Reading proficient: 81%
— Math proficient: 71%
— AP enrollment: 46%
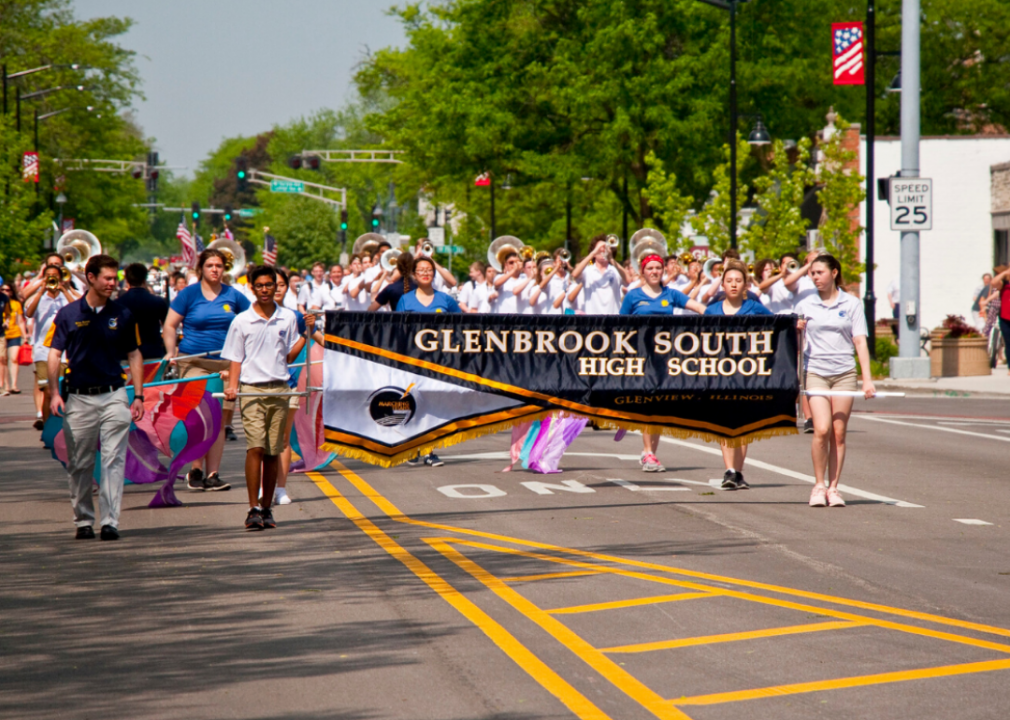
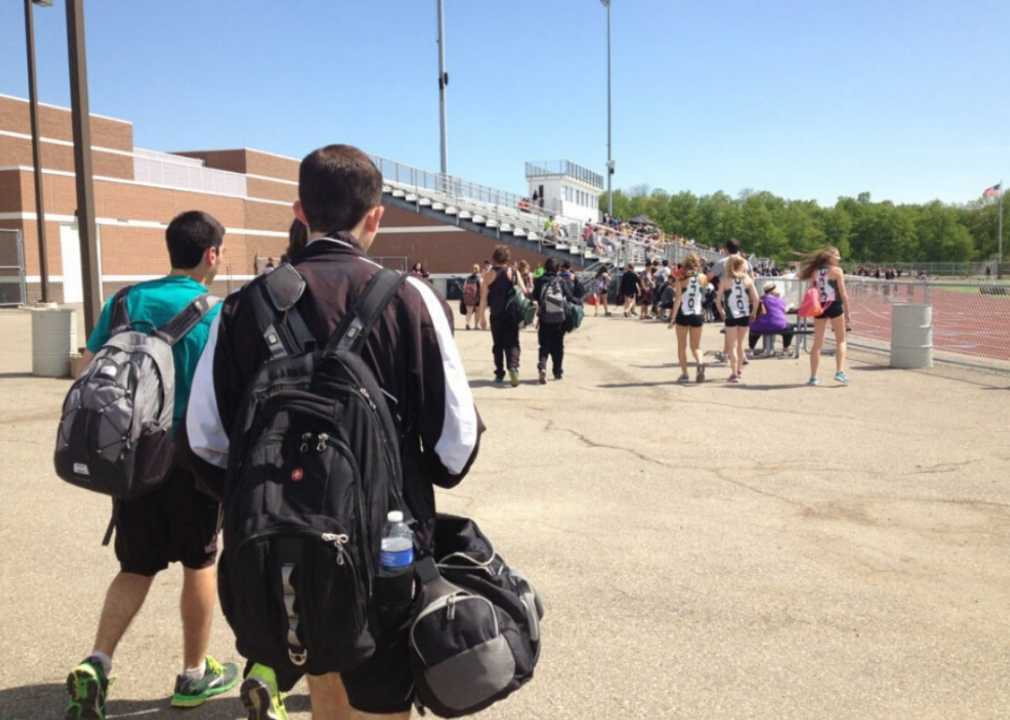
Charles Edward Miller // Flickr
#78. Glenbrook South High School
– Location: Glenview, IL
– Grades offered: 9-12
– Students: 3,067 (51% female; 49% male)
– Racial composition: 62.8% White; 17.9% Asian; 13.2% Hispanic; 4.2% Multiracial
– Student-teacher ratio: 16:1
– Academic achievement:
— Reading proficient: 67%
— Math proficient: 67%
— AP enrollment: 27%

dotshock // Shutterstock
#77. Academy for Information Technology
– Location: Scotch Plains, NJ
– Grades offered: 9-12
– Students: 284 (31% female; 69% male)
– Racial composition: 45.1% White; 24.6% Asian; 20.1% Hispanic; 8.1% Black
– Student-teacher ratio: 19:1
– Academic achievement:
— Reading proficient: 97%
— Math proficient: 92%
— AP enrollment: 44%

Canva
#76. Herricks High School
– Location: New Hyde Park, NY
– Grades offered: 8-12
– Students: 1,295 (49% female; 51% male)
– Racial composition: 63.0% Asian; 28.6% White; 6.6% Hispanic; 1.0% Black
– Student-teacher ratio: 13:1
– Academic achievement:
— Reading proficient: 99%
— Math proficient: 99%
— AP enrollment: 56%
You may also like: Best places to retire on the East Coast
Teemu008 // Flickr
#75. Libertyville High School
– Location: Libertyville, IL
– Grades offered: 9-12
– Students: 1,857 (49% female; 51% male)
– Racial composition: 80.7% White; 8.6% Asian; 7.4% Hispanic; 1.5% Black
– Student-teacher ratio: 14:1
– Academic achievement:
— Reading proficient: 77%
— Math proficient: 75%
— AP enrollment: 37%

Canva
#74. Troy High School
– Location: Fullerton, CA
– Grades offered: 9-12
– Students: 2,614 (47% female; 53% male)
– Racial composition: 52.8% Asian; 26.7% Hispanic; 14.5% White; 4.3% Multiracial
– Student-teacher ratio: 25:1
– Academic achievement:
— Reading proficient: 84%
— Math proficient: 75%
— AP enrollment: 53%
Leifern // Wikimedia Commons
#73. Millburn Senior High School
– Location: Millburn, NJ
– Grades offered: 9-12
– Students: 1,385 (48% female; 52% male)
– Racial composition: 60.0% White; 26.9% Asian; 5.9% Hispanic; 4.8% Multiracial
– Student-teacher ratio: 11:1
– Academic achievement:
— Reading proficient: 81%
— Math proficient: 73%
— AP enrollment: 34%
Chandlernews // Wikimedia Commons
#72. BASIS Chandler
– Location: Chandler, AZ
– Grades offered: 5-12
– Students: 897 (49% female; 51% male)
– Racial composition: 73.6% Asian; 18.8% White; 3.6% Hispanic; 1.8% Multiracial
– Student-teacher ratio: 16:1
– Academic achievement:
— Reading proficient: 89%
— Math proficient: 97%
— AP enrollment: 100%
Ruokai Chen and Arjun Gopalratnam // Wikimedia Commons
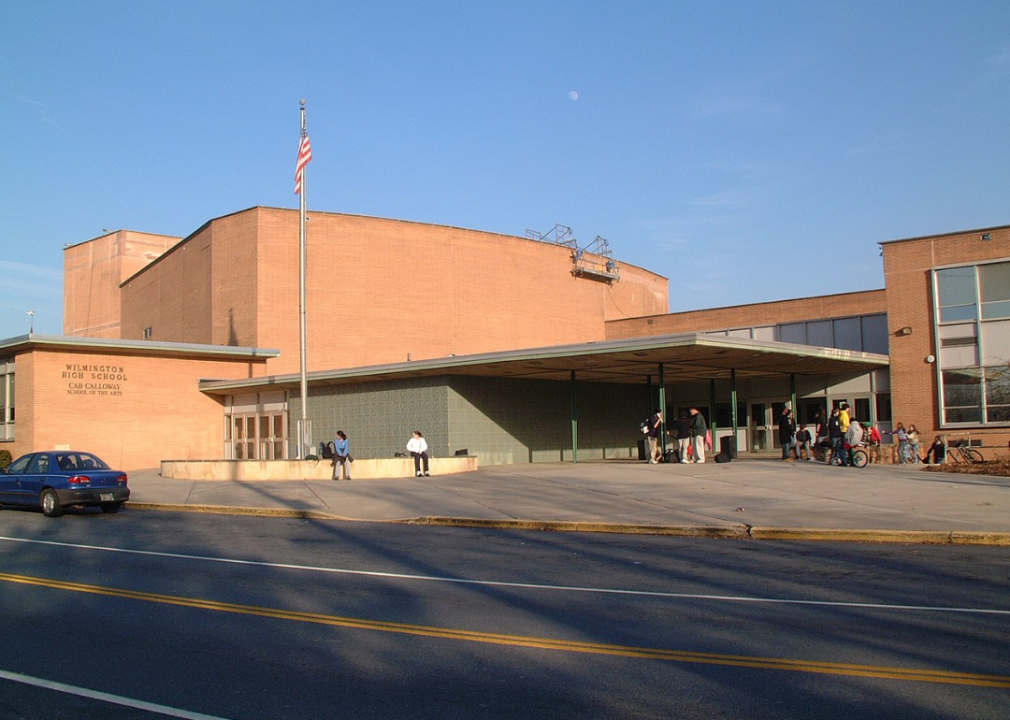
#71. Charter School of Wilmington
– Location: Wilmington, DE
– Grades offered: 9-12
– Students: 972 (49% female; 51% male)
– Racial composition: 52.5% White; 32.0% Asian; 7.8% Black; 4.7% Hispanic
– Student-teacher ratio: 19:1
– Academic achievement:
— Reading proficient: 98%
— Math proficient: 93%
— AP enrollment: 42%
You may also like: Most common jobs in America 100 years ago

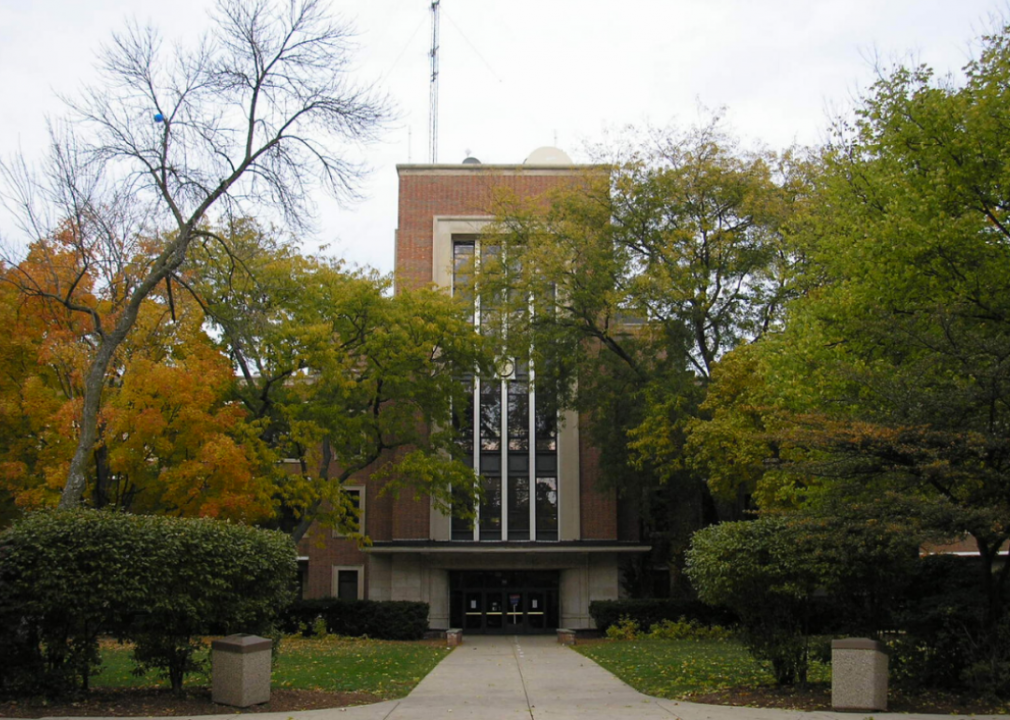
John Schanlaub // Wikimedia Commons
#70. West Lafayette Junior/Senior High School
– Location: West Lafayette, IN
– Grades offered: 7-12
– Students: 1,141 (48% female; 52% male)
– Racial composition: 60.5% White; 22.9% Asian; 6.0% Hispanic; 5.3% Multiracial
– Student-teacher ratio: 16:1
– Academic achievement:
— Reading proficient: 81%
— Math proficient: 76%
— AP enrollment: 34%

Monkey Business Images // Shutterstock
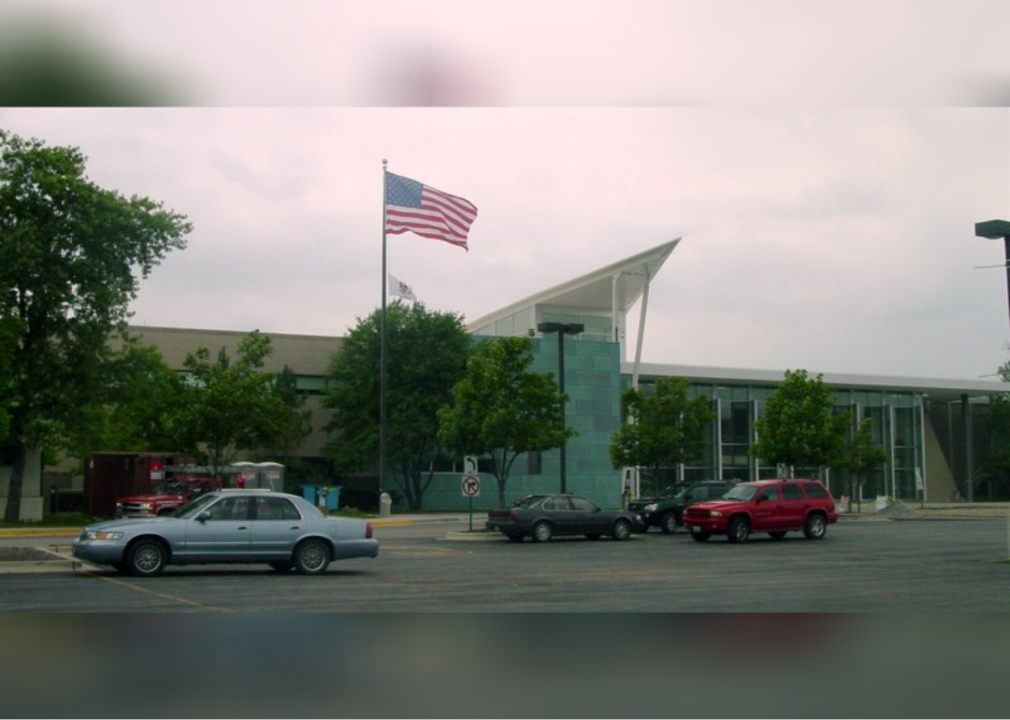
#69. International Academy
– Location: Bloomfield Hills, MI
– Grades offered: 9-12
– Students: 1,371 (52% female; 48% male)
– Racial composition: 51.0% White; 39.0% Asian; 3.0% Black; 2.0% Multiracial
– Student-teacher ratio: 108:1
– Academic achievement:
— Reading proficient: 96%
— Math proficient: 98%
— AP enrollment: unavailable
Lincoln Beddoe // Shutterstock
#68. University High School
– Location: Tucson, AZ
– Grades offered: 8-12
– Students: 1,097 (58% female; 42% male)
– Racial composition: 44.6% White; 35.2% Hispanic; 11.7% Asian; 7.0% Multiracial
– Student-teacher ratio: 21:1
– Academic achievement:
— Reading proficient: 99%
— Math proficient: 99%
— AP enrollment: 100%
Sreejithk2000 // Wikimedia Commons
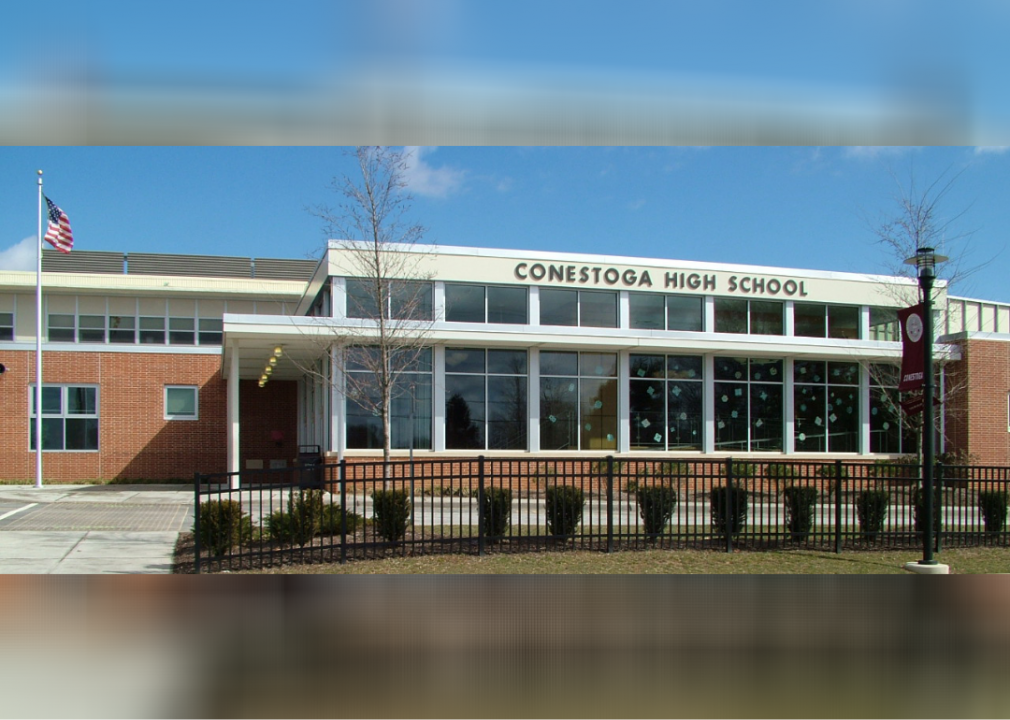
#67. Conestoga Senior High School
– Location: Berwyn, PA
– Grades offered: 9-12
– Students: 2,219 (49% female; 51% male)
– Racial composition: 72.4% White; 19.7% Asian; 3.2% Black; 3.0% Hispanic
– Student-teacher ratio: 16:1
– Academic achievement:
— Reading proficient: 91%
— Math proficient: 94%
— AP enrollment: 52%
Foursquare
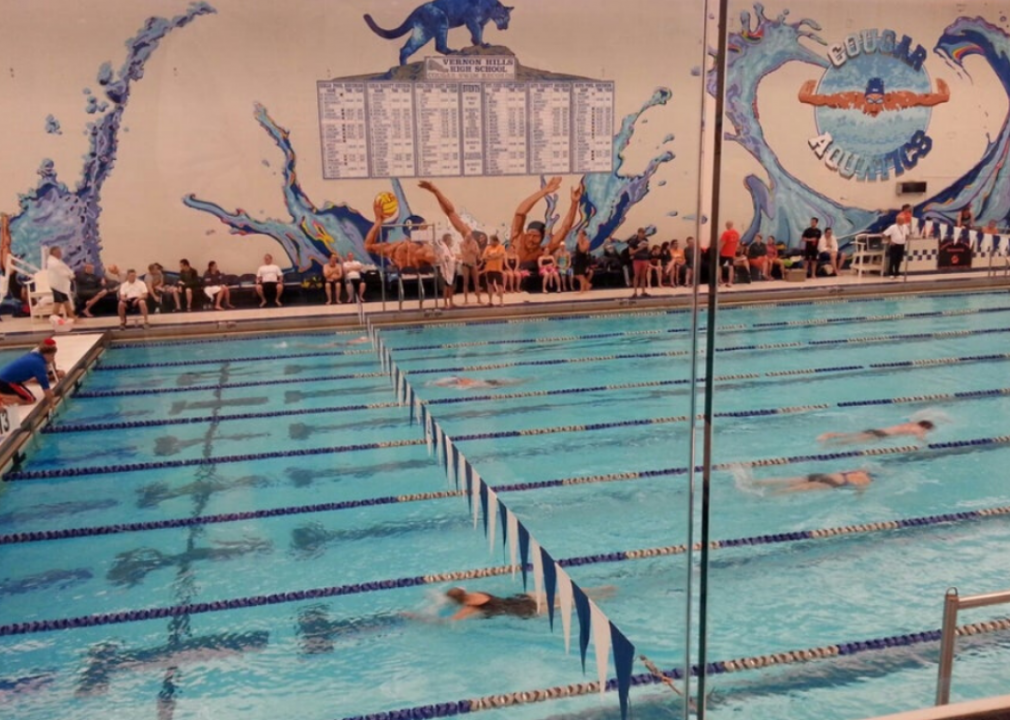
#66. Vernon Hills High School
– Location: Vernon Hills, IL
– Grades offered: 9-12
– Students: 1,459 (50% female; 50% male)
– Racial composition: 59.4% White; 21.7% Asian; 14.1% Hispanic; 2.5% Black
– Student-teacher ratio: 14:1
– Academic achievement:
— Reading proficient: 72%
— Math proficient: 73%
— AP enrollment: 33%
You may also like: The best streaming services in 2021
gremlinworks // Shutterstock
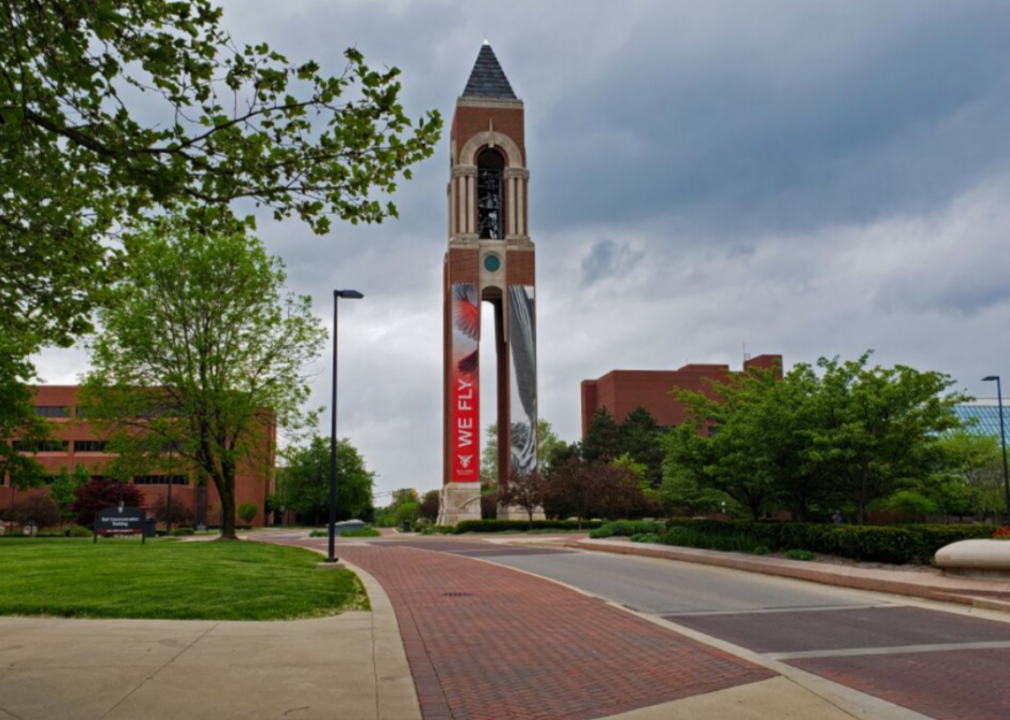
#65. Indiana Academy for Science, Mathematics, and Humanities
– Location: Muncie, IN
– Grades offered: 11-12
– Students: 307 (62% female; 38% male)
– Racial composition: 70.7% White; 14.3% Asian; 5.9% Multiracial; 4.6% Black
– Student-teacher ratio: 9:1

Lmcdowell7 // Wikimedia Commons
#64. Downingtown STEM Academy
– Location: Downingtown, PA
– Grades offered: 9-12
– Students: 819 (53% female; 47% male)
– Racial composition: 63.9% White; 31.0% Asian; 2.6% Hispanic; 1.7% Black
– Student-teacher ratio: 14:1
– Academic achievement:
— Reading proficient: 95%
— Math proficient: 95%
— AP enrollment: unavailable
W.marsh // Wikimedia Commons
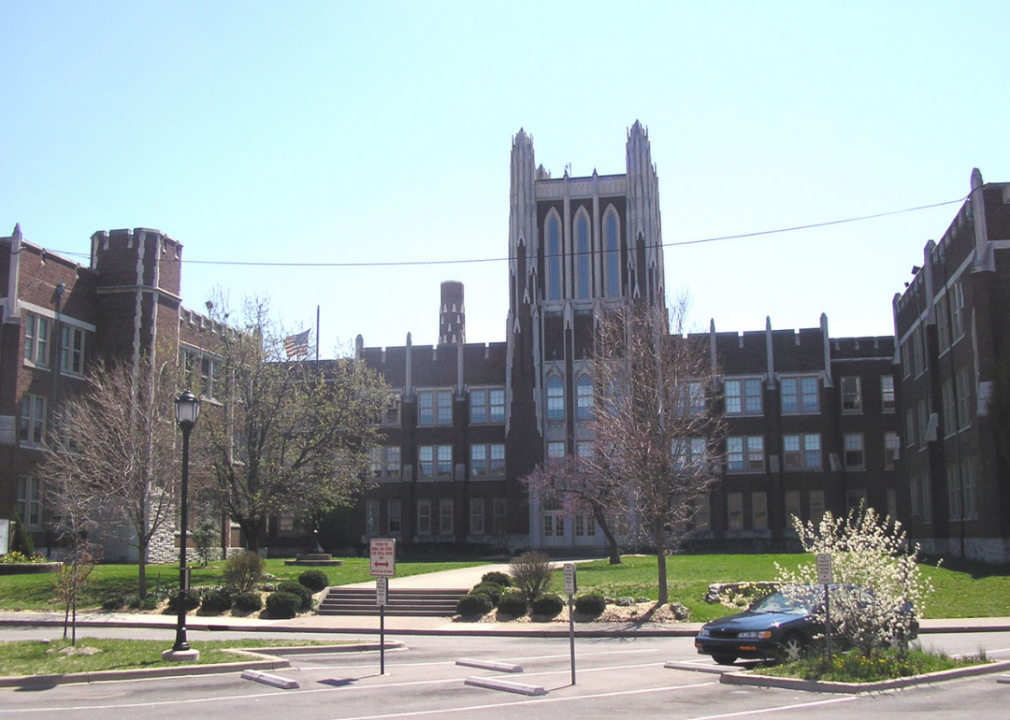
#63. DuPont Manual High School
– Location: Louisville, KY
– Grades offered: 9-12
– Students: 1,919 (59% female; 41% male)
– Racial composition: 59.4% White; 18.0% Asian; 14.9% Black; 4.8% Hispanic
– Student-teacher ratio: 18:1
– Academic achievement:
— Reading proficient: 93%
— Math proficient: 85%
— AP enrollment: 81%
Ravi Tek // Wikimedia Commons
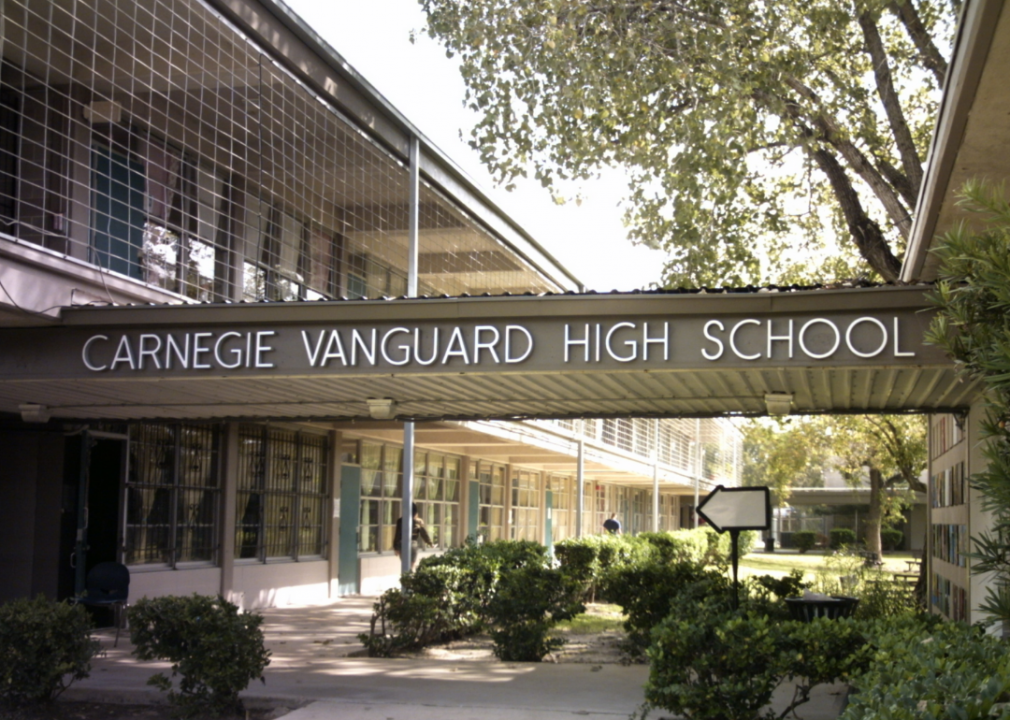
#62. Carnegie Vanguard High School
– Location: Houston, TX
– Grades offered: 9-12
– Students: 808 (53% female; 47% male)
– Racial composition: 32.1% Hispanic; 30.4% Asian; 23.3% White; 10.5% Black
– Student-teacher ratio: 26:1
– Academic achievement:
— Reading proficient: 95%
— Math proficient: 90%
— AP enrollment: 100%
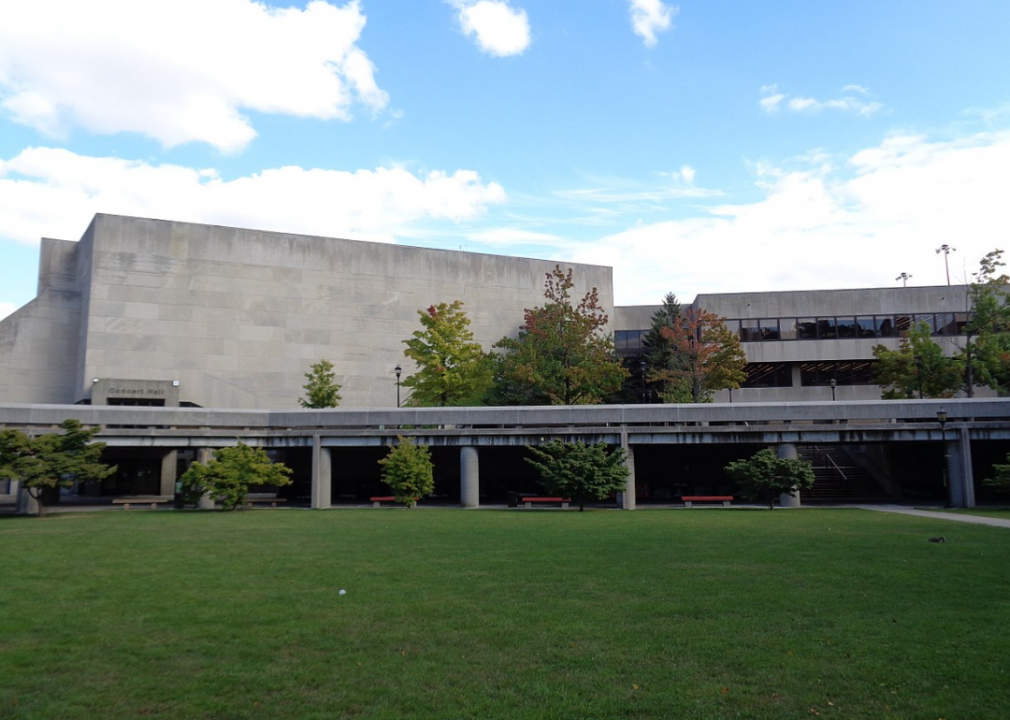
Slo-mo // Wikimedia Commmons
#61. New Trier Township High School
– Location: Winnetka, IL
– Grades offered: 10-12
– Students: 2,963 (49% female; 51% male)
– Racial composition: 79.9% White; 9.5% Asian; 4.9% Hispanic; 4.8% Multiracial
– Student-teacher ratio: 12:1
– Academic achievement:
— Reading proficient: 80%
— Math proficient: 76%
— AP enrollment: 27%
You may also like: History of oil in America

Canva
#60. Middlesex County Academy for Science, Mathematics, & Engineering Technologies
– Location: Edison, NJ
– Grades offered: 9-12
– Students: 159 (40% female; 60% male)
– Racial composition: 83.6% Asian; 8.8% White; 6.3% Hispanic; 0.6% Black
– Student-teacher ratio: 13:1
– Academic achievement:
— Reading proficient: 95%
— Math proficient: 90%
— AP enrollment: 25%

Canva
#59. Ladue Horton Watkins High School
– Location: St Louis, MO
– Grades offered: 9-12
– Students: 1,311 (48% female; 52% male)
– Racial composition: 58.3% White; 16.0% Black; 15.0% Asian; 6.0% Hispanic
– Student-teacher ratio: 15:1
– Academic achievement:
— Reading proficient: 72%
— Math proficient: 79%
— AP enrollment: 40%

Canva
#58. Syosset Senior High School
– Location: Syosset, NY
– Grades offered: 9-12
– Students: 2,131 (49% female; 51% male)
– Racial composition: 59.6% White; 34.7% Asian; 3.5% Hispanic; 1.2% Multiracial
– Student-teacher ratio: 10:1
– Academic achievement:
— Reading proficient: 99%
— Math proficient: 99%
— AP enrollment: 65%
Marcmann15 // Wikimedia Commons
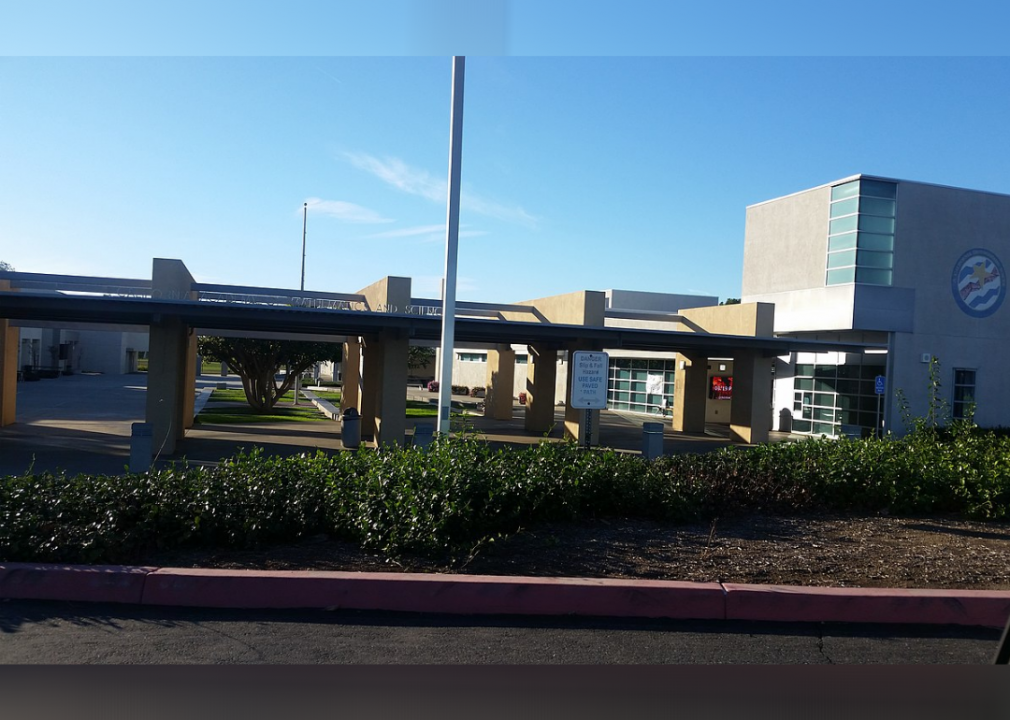
#57. California Academy of Mathematics & Science
– Location: Carson, CA
– Grades offered: 9-12
– Students: 667 (54% female; 46% male)
– Racial composition: 42.3% Hispanic; 37.2% Asian; 7.3% Black; 6.4% White
– Student-teacher ratio: 28:1
– Academic achievement:
— Reading proficient: 95%
— Math proficient: 95%
— AP enrollment: 56%
Africa Studio // Shutterstock
#56. BASIS Peoria
– Location: Peoria, AZ
– Grades offered: 5-12
– Students: 772 (49% female; 51% male)
– Racial composition: 52.7% Asian; 36.0% White; 5.4% Hispanic; 3.6% Black
– Student-teacher ratio: 18:1
– Academic achievement:
— Reading proficient: 87%
— Math proficient: 94%
— AP enrollment: 97%
You may also like: States receiving the most federal funds
Tdorante10 // Wikimedia Commons
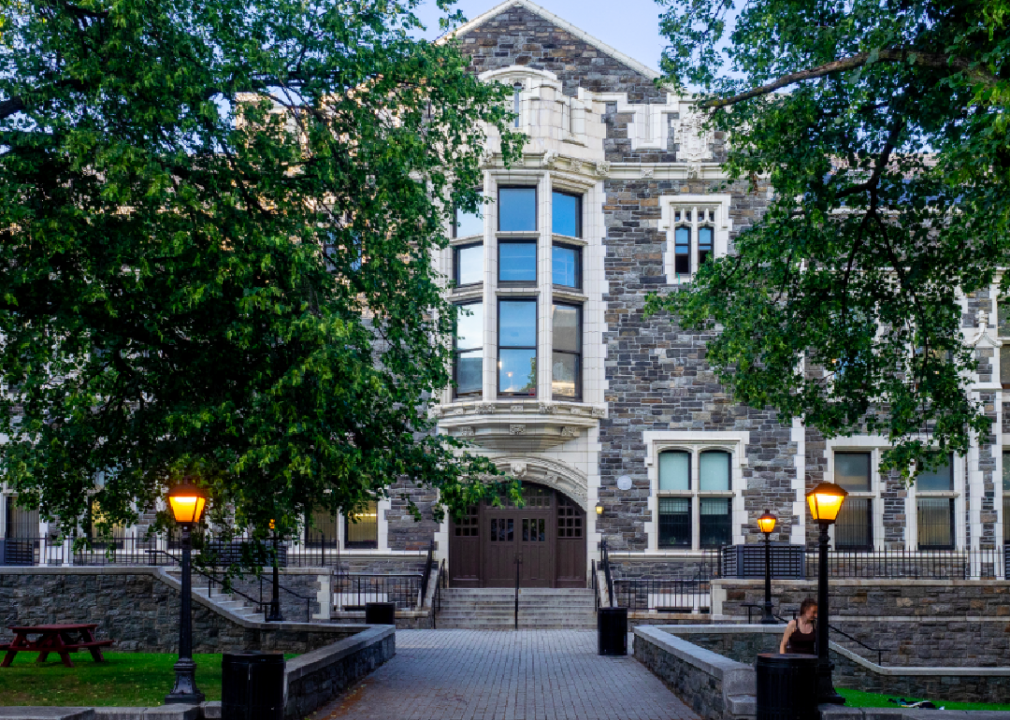
#55. High School of American Studies at Lehman College
– Location: Bronx, NY
– Grades offered: 9-12
– Students: 412 (52% female; 48% male)
– Racial composition: 56.6% White; 20.6% Asian; 9.7% Hispanic; 7.3% Multiracial
– Student-teacher ratio: 16:1
– Academic achievement:
— Reading proficient: 95%
— Math proficient: 95%
— AP enrollment: 71%
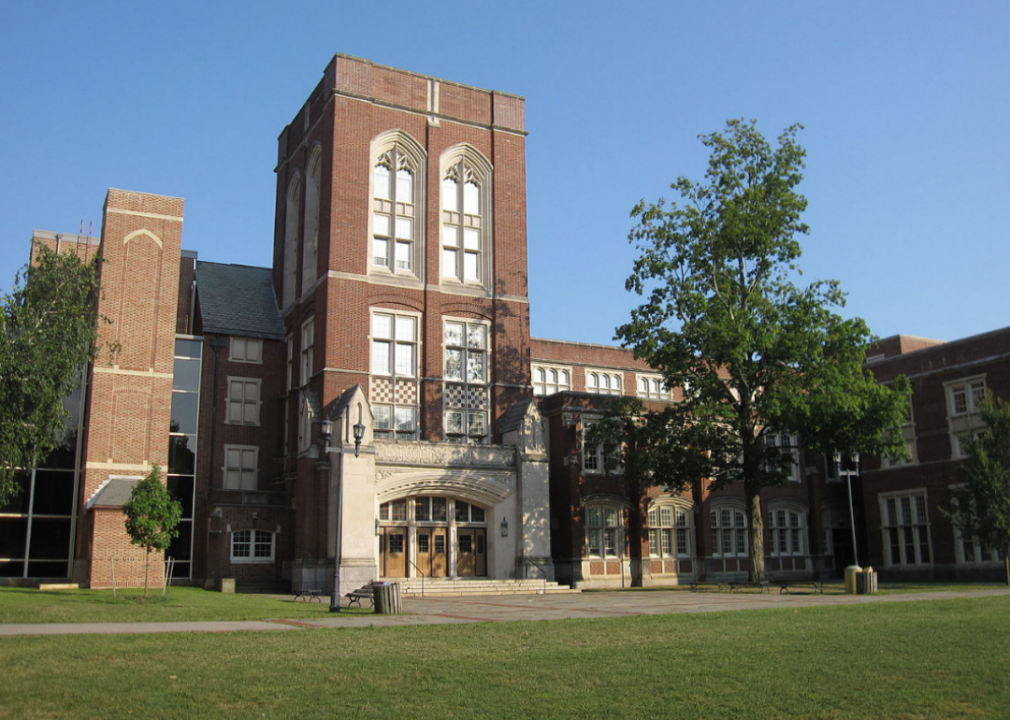
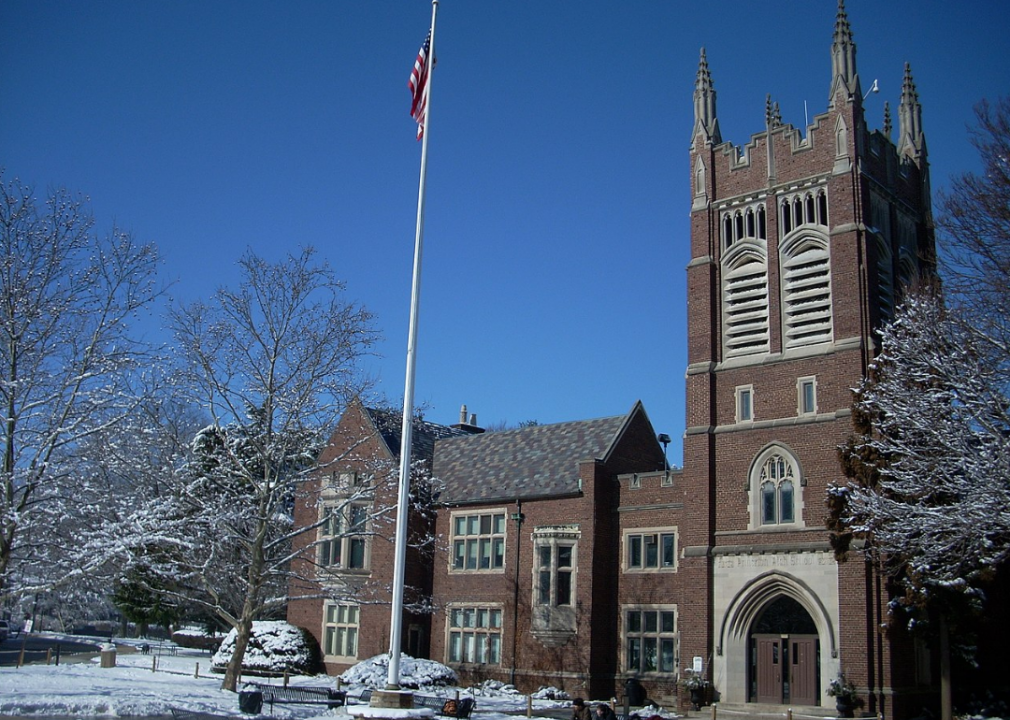
Jweiss11 // Wikimedia Commons
#54. Scarsdale Senior High School
– Location: Scarsdale, NY
– Grades offered: 9-12
– Students: 1,530 (50% female; 50% male)
– Racial composition: 68.4% White; 16.7% Asian; 7.8% Hispanic; 5.6% Multiracial
– Student-teacher ratio: 12:1
– Academic achievement:
— Reading proficient: 99%
— Math proficient: 99%
— AP enrollment: unavailable

Canva
#53. Jones College Prep High School
– Location: Chicago, IL
– Grades offered: 9-12
– Students: 1,908 (59% female; 41% male)
– Racial composition: 37.9% White; 29.5% Hispanic; 14.3% Asian; 11.9% Black
– Student-teacher ratio: 18:1
– Academic achievement:
— Reading proficient: 90%
— Math proficient: 90%
— AP enrollment: 48%
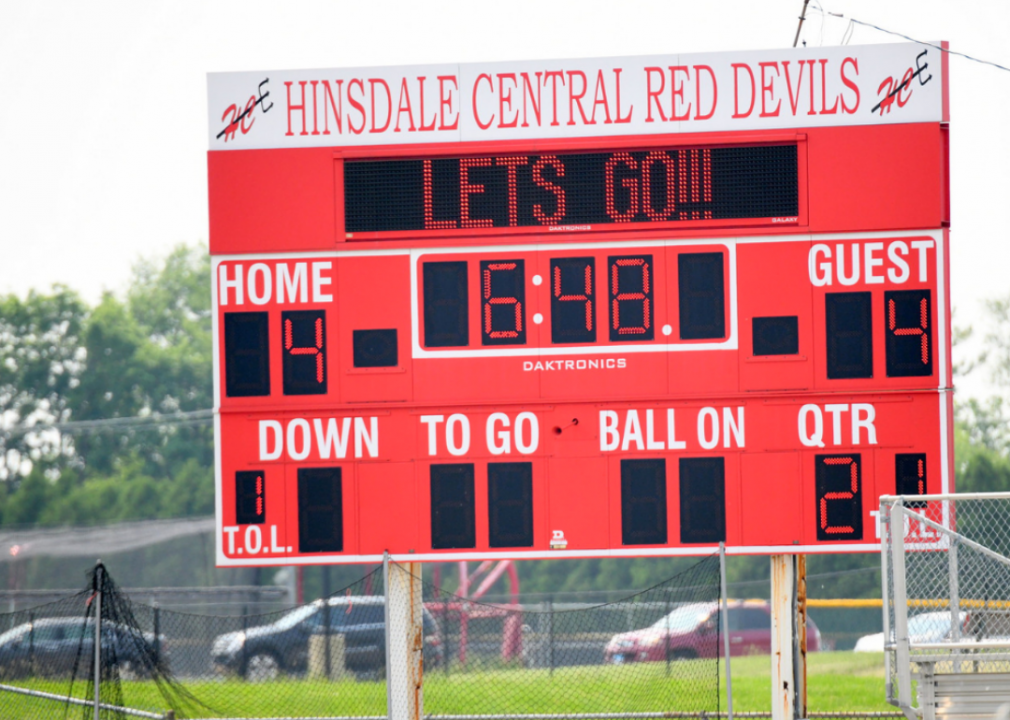
Jim Larrison // Flickr
#52. Hinsdale Central High School
– Location: Hinsdale, IL
– Grades offered: 9-12
– Students: 2,728 (48% female; 52% male)
– Racial composition: 69.2% White; 18.6% Asian; 7.0% Hispanic; 3.0% Multiracial
– Student-teacher ratio: 13:1
– Academic achievement:
— Reading proficient: 79%
— Math proficient: 75%
— AP enrollment: 37%

Canva
#51. Indian Hill High School
– Location: Cincinnati, OH
– Grades offered: 9-12
– Students: 639 (49% female; 51% male)
– Racial composition: 78.9% White; 10.0% Asian; 3.9% Multiracial; 3.8% Black
– Student-teacher ratio: 12:1
– Academic achievement:
— Reading proficient: 92%
— Math proficient: 77%
— AP enrollment: 60%
You may also like: 50 remote jobs that can pay well
Jesse Kunerth // Shutterstock
#50. BASIS Tucson North
– Location: Tucson, AZ
– Grades offered: 5-12
– Students: 960 (51% female; 49% male)
– Racial composition: 56.6% White; 19.1% Hispanic; 18.3% Asian; 2.7% Black
– Student-teacher ratio: 14:1
– Academic achievement:
— Reading proficient: 83%
— Math proficient: 89%
— AP enrollment: 100%
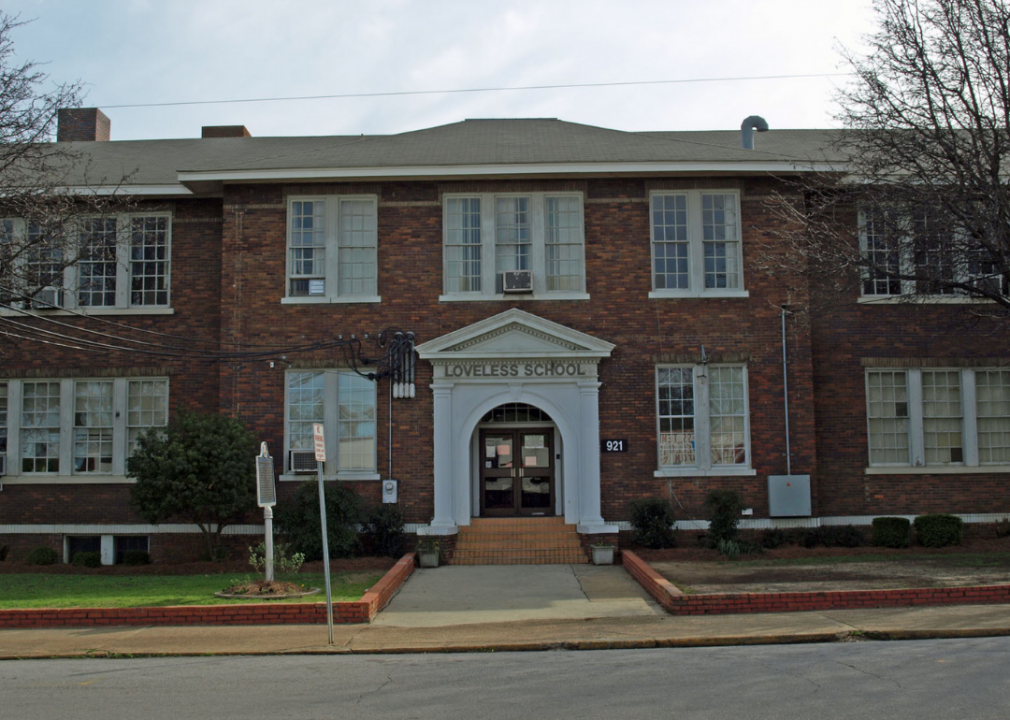
Chris Pruitt // Wikimedia Commons
#49. Loveless Academic Magnet Program High School
– Location: Montgomery, AL
– Grades offered: 9-12
– Students: 513 (60% female; 40% male)
– Racial composition: 38.6% White; 29.6% Asian; 25.5% Black; 3.3% Hispanic
– Student-teacher ratio: 15:1
– Academic achievement:
— Reading proficient: 95%
— Math proficient: 95%
— AP enrollment: 93%

connel // Shutterstock
#48. Academic Magnet High School
– Location: North Charleston, SC
– Grades offered: 9-12
– Students: 655 (55% female; 45% male)
– Racial composition: 78.0% White; 9.3% Asian; 4.9% Hispanic; 4.0% Multiracial
– Student-teacher ratio: 17:1
– Academic achievement:
— Reading proficient: 95%
— Math proficient: 95%
— AP enrollment: 65%
Henry Gray // Wikimedia Commons
#47. Princeton High School
– Location: Princeton, NJ
– Grades offered: 9-12
– Students: 1,590 (48% female; 52% male)
– Racial composition: 55.2% White; 23.7% Asian; 11.3% Hispanic; 5.3% Black
– Student-teacher ratio: 12:1
– Academic achievement:
— Reading proficient: 76%
— Math proficient: 48%
— AP enrollment: 51%
Ajay Suresh // Wikimedia Commons
#46. High School Math Science & Engineering at The City College of New York (CCNY)
– Location: New York, NY
– Grades offered: 9-12
– Students: 490 (38% female; 62% male)
– Racial composition: 30.2% White; 28.8% Asian; 16.7% Hispanic; 13.3% Multiracial
– Student-teacher ratio: 16:1
– Academic achievement:
— Reading proficient: 95%
— Math proficient: 95%
— AP enrollment: 96%
[Pictured: The City College of New York (CCNY).]
You may also like: History of manufacturing in America

katalinks // Shutterstock
#45. Westlake High School
– Location: Austin, TX
– Grades offered: 9-12
– Students: 2,772 (48% female; 52% male)
– Racial composition: 69.0% White; 13.5% Asian; 12.5% Hispanic; 3.9% Multiracial
– Student-teacher ratio: 15:1
– Academic achievement:
— Reading proficient: 89%
— Math proficient: 73%
— AP enrollment: 68%
David Sawyer // Wikimedia Commons
#44. Palo Alto High School
– Location: Palo Alto, CA
– Grades offered: 9-12
– Students: 2,124 (50% female; 50% male)
– Racial composition: 45.4% White; 33.5% Asian; 11.9% Hispanic; 6.3% Multiracial
– Student-teacher ratio: 18:1
– Academic achievement:
— Reading proficient: 82%
— Math proficient: 82%
— AP enrollment: 40%
Ragib Hasan // Wikimedia Commons
#43. University of Illinois High School
– Location: Urbana, IL
– Grades offered: 8-12
– Students: 309 (50% female; 50% male)
– Racial composition: 42.4% White; 34.0% Asian; 12.3% Multiracial; 6.8% Hispanic
– Student-teacher ratio: 21:1
Usasuk // Shutterstock
#42. BASIS Oro Valley
– Location: Oro Valley, AZ
– Grades offered: 6-12
– Students: 595 (47% female; 53% male)
– Racial composition: 54.6% White; 24.0% Asian; 15.0% Hispanic; 4.0% Multiracial
– Student-teacher ratio: 6:1
– Academic achievement:
— Reading proficient: 93%
— Math proficient: 93%
— AP enrollment: 100%

Canva
#41. Julia R. Masterman Secondary School
– Location: Philadelphia, PA
– Grades offered: 5-12
– Students: 1,214 (53% female; 47% male)
– Racial composition: 40.5% White; 29.0% Asian; 15.5% Black; 9.6% Multiracial
– Student-teacher ratio: 22:1
– Academic achievement:
— Reading proficient: 99%
— Math proficient: 96%
— AP enrollment: 42%
You may also like: Worst jobs in America

Andy M. Wang // Wikimedia Commons
#40. Bergen County Technical High School – Teterboro
– Location: Teterboro, NJ
– Grades offered: 9-12
– Students: 666 (51% female; 49% male)
– Racial composition: 42.2% White; 29.7% Asian; 19.4% Hispanic; 7.4% Black
– Student-teacher ratio: 10:1
– Academic achievement:
— Reading proficient: 96%
— Math proficient: 93%
— AP enrollment: 54%

Canva
#39. Pine View School
– Location: Osprey, FL
– Grades offered: 2-12
– Students: 1,925 (49% female; 51% male)
– Racial composition: 66.6% White; 14.5% Asian; 10.3% Hispanic; 7.1% Multiracial
– Student-teacher ratio: 17:1
– Academic achievement:
— Reading proficient: 99%
— Math proficient: 99%
— AP enrollment: 77%
Unknown // Wikimedia Commons
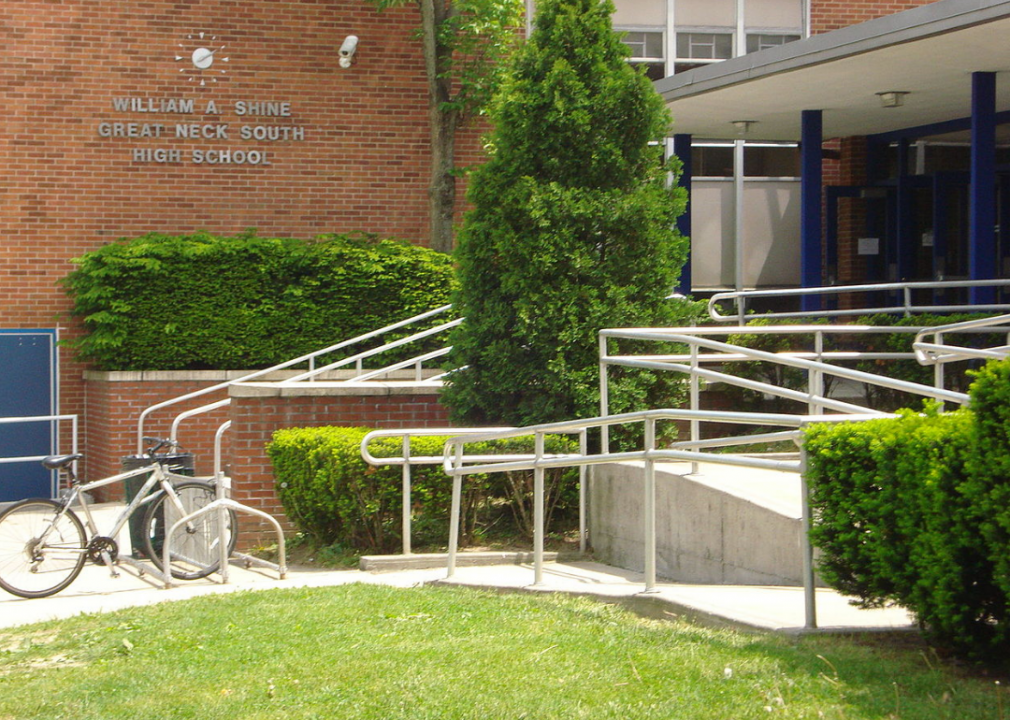
#38. Great Neck South High School
– Location: Great Neck, NY
– Grades offered: 9-12
– Students: 1,222 (46% female; 54% male)
– Racial composition: 58.8% Asian; 30.0% White; 7.7% Hispanic; 2.0% Multiracial
– Student-teacher ratio: 11:1
– Academic achievement:
— Reading proficient: 98%
— Math proficient: 99%
— AP enrollment: 45%

Chinnapong // Shutterstock
#37. The Academy for Mathematics, Science & Engineering
– Location: Rockaway, NJ
– Grades offered: 9-12
– Students: 101 (47% female; 53% male)
– Racial composition: 79.2% Asian; 18.8% White; 1.0% Black; 1.0% Hispanic
– Student-teacher ratio: 16:1
– Academic achievement:
— Reading proficient: 90%
— Math proficient: unavailable
— AP enrollment: 98%
David Sawyer // Flickr
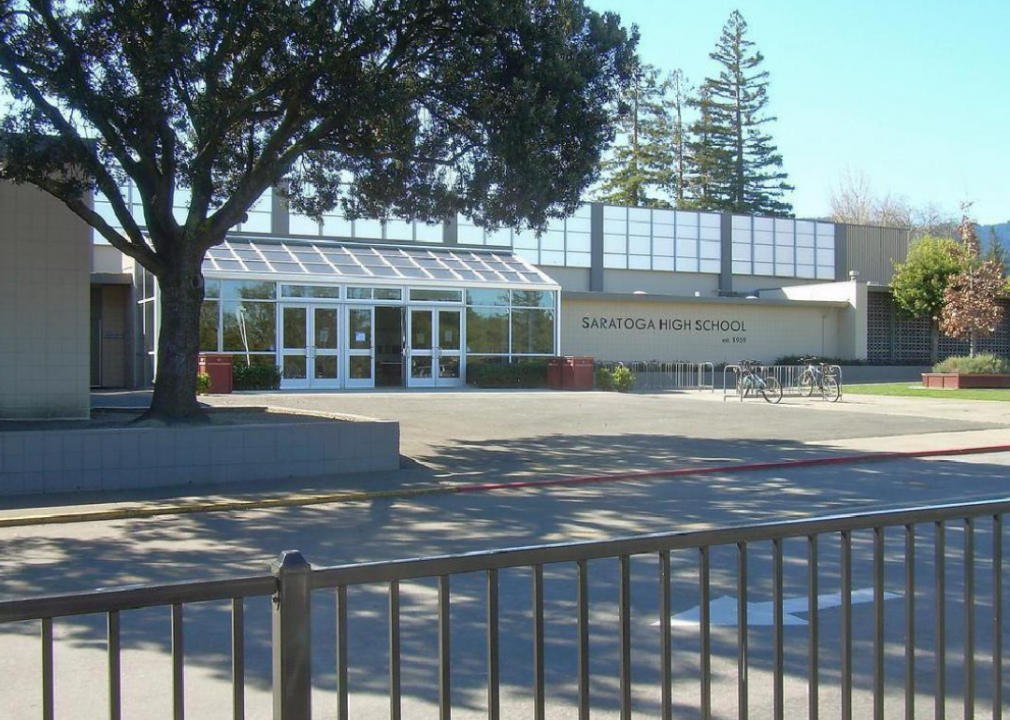
#36. Saratoga High School
– Location: Saratoga, CA
– Grades offered: 9-12
– Students: 1,371 (48% female; 52% male)
– Racial composition: 61.6% Asian; 24.7% White; 9.4% Multiracial; 3.7% Hispanic
– Student-teacher ratio: 20:1
– Academic achievement:
— Reading proficient: 92%
— Math proficient: 88%
— AP enrollment: 46%
You may also like: Best places to retire in the Midwest

Canva
#35. Tesla STEM High School
– Location: Redmond, WA
– Grades offered: 9-12
– Students: 601 (42% female; 58% male)
– Racial composition: 53.1% Asian; 36.9% White; 5.2% Multiracial; 4.2% Hispanic
– Student-teacher ratio: 21:1
– Academic achievement:
— Reading proficient: 95%
— Math proficient: 95%
— AP enrollment: 71%

Canva
#34. The Early College at Guilford
– Location: Greensboro, NC
– Grades offered: 9-12
– Students: 199 (55% female; 45% male)
– Racial composition: 44.2% White; 41.2% Asian; 6.5% Black; 4.5% Multiracial
– Student-teacher ratio: 25:1
– Academic achievement:
— Reading proficient: 90%
— Math proficient: 90%
— AP enrollment: 54%
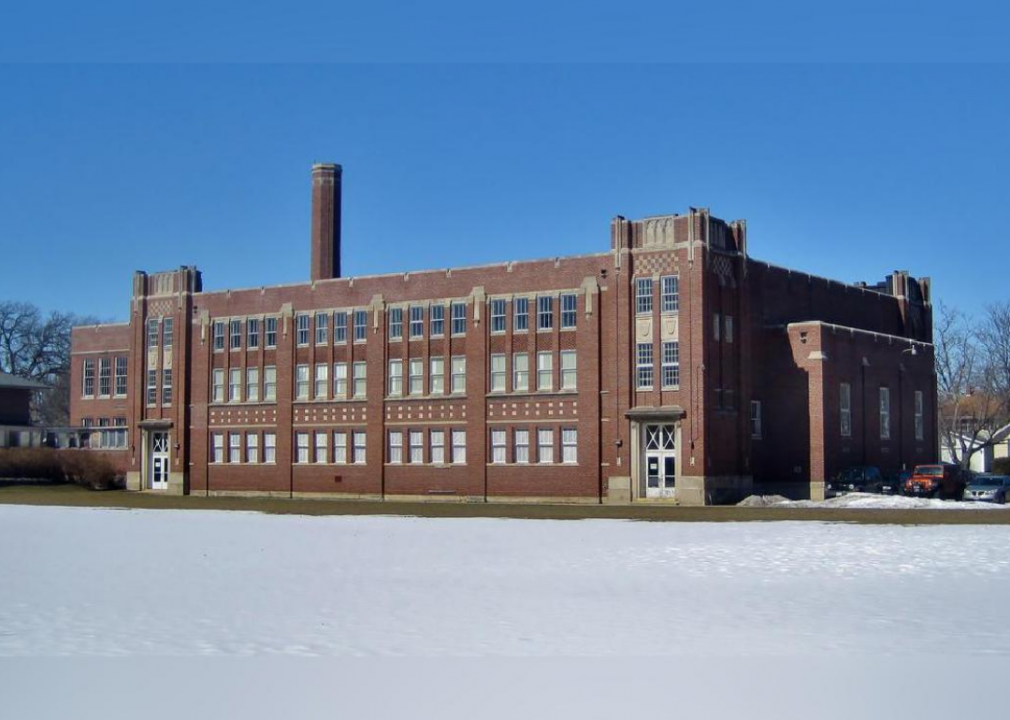
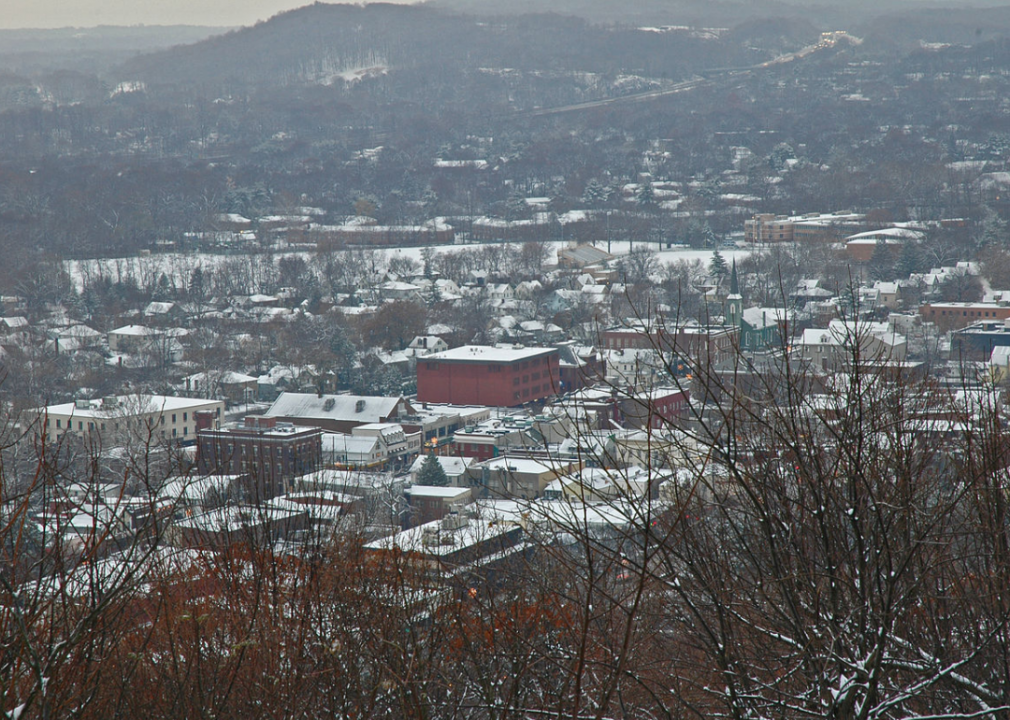
Nyttend // Wikimedia Commons
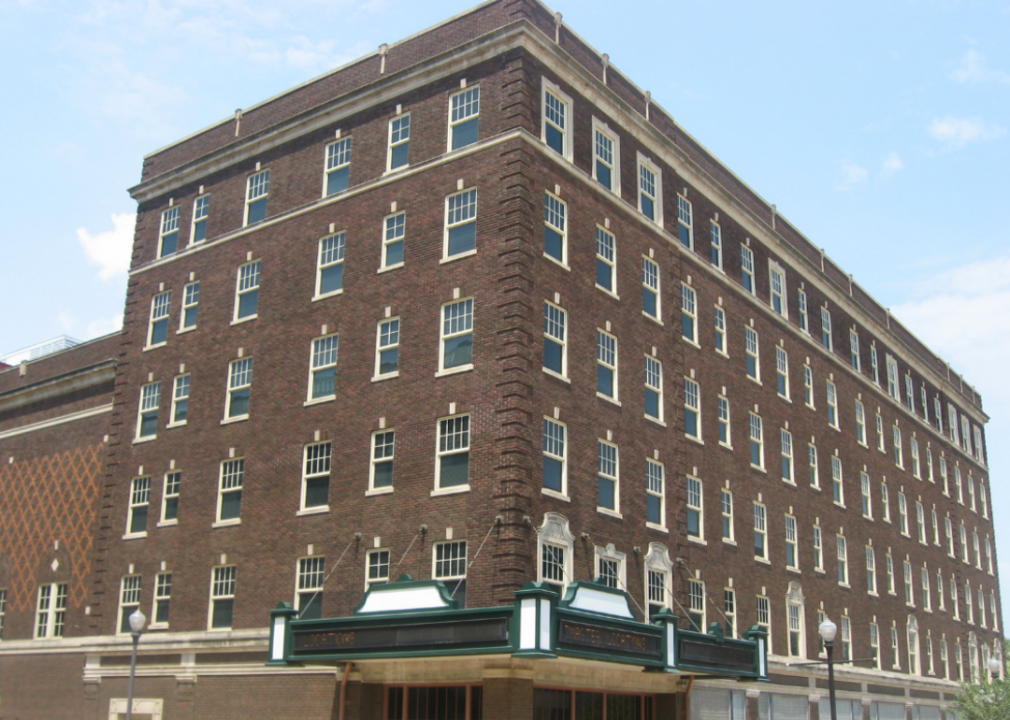
#33. Signature School
– Location: Evansville, IN
– Grades offered: 9-12
– Students: 390 (57% female; 43% male)
– Racial composition: 70.0% White; 16.9% Asian; 6.4% Multiracial; 4.4% Hispanic
– Student-teacher ratio: 14:1
– Academic achievement:
— Reading proficient: 95%
— Math proficient: 87%
— AP enrollment: 99%
Tallyman // Wikimedia Commons
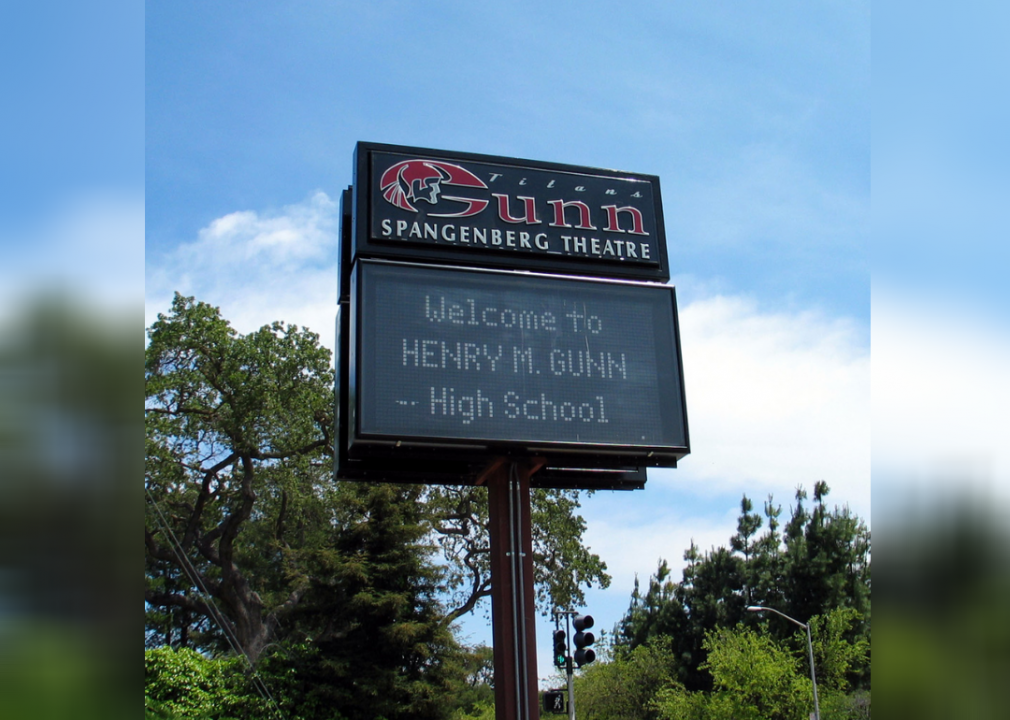
#32. Henry M. Gunn High School
– Location: Palo Alto, CA
– Grades offered: 9-12
– Students: 2,006 (47% female; 53% male)
– Racial composition: 44.1% Asian; 37.0% White; 9.2% Hispanic; 7.9% Multiracial
– Student-teacher ratio: 19:1
– Academic achievement:
— Reading proficient: 90%
— Math proficient: 86%
— AP enrollment: 42%

Vereshchagin Dmitry // Shutterstock
#31. Poolesville High School
– Location: Poolesville, MD
– Grades offered: 9-12
– Students: 1,185 (50% female; 50% male)
– Racial composition: 48.9% White; 31.5% Asian; 8.2% Hispanic; 5.7% Black
– Student-teacher ratio: 19:1
– Academic achievement:
— Reading proficient: 72%
— Math proficient: 95%
— AP enrollment: 65%
You may also like: Most popular college majors in America
Docnavi // Wikimedia Commons
#30. Canyon Crest Academy
– Location: San Diego, CA
– Grades offered: 9-12
– Students: 2,572 (50% female; 50% male)
– Racial composition: 53.5% White; 33.9% Asian; 7.5% Hispanic; 4.0% Multiracial
– Student-teacher ratio: 4:1
– Academic achievement:
— Reading proficient: 90%
— Math proficient: 82%
— AP enrollment: 57%

James Steidl // Shutterstock
#29. Union County Magnet High School
– Location: Scotch Plains, NJ
– Grades offered: 9-12
– Students: 303 (43% female; 57% male)
– Racial composition: 39.6% White; 35.3% Asian; 15.8% Hispanic; 8.3% Black
– Student-teacher ratio: 23:1
– Academic achievement:
— Reading proficient: 99%
— Math proficient: 95%
— AP enrollment: 47%

Canva
#28. Raleigh Charter High School
– Location: Raleigh, NC
– Grades offered: 9-12
– Students: 563 (50% female; 50% male)
– Racial composition: 61.1% White; 25.2% Asian; 4.6% Multiracial; 4.4% Black
– Student-teacher ratio: 14:1
– Academic achievement:
— Reading proficient: 95%
— Math proficient: 92%
— AP enrollment: 54%
Foursquare
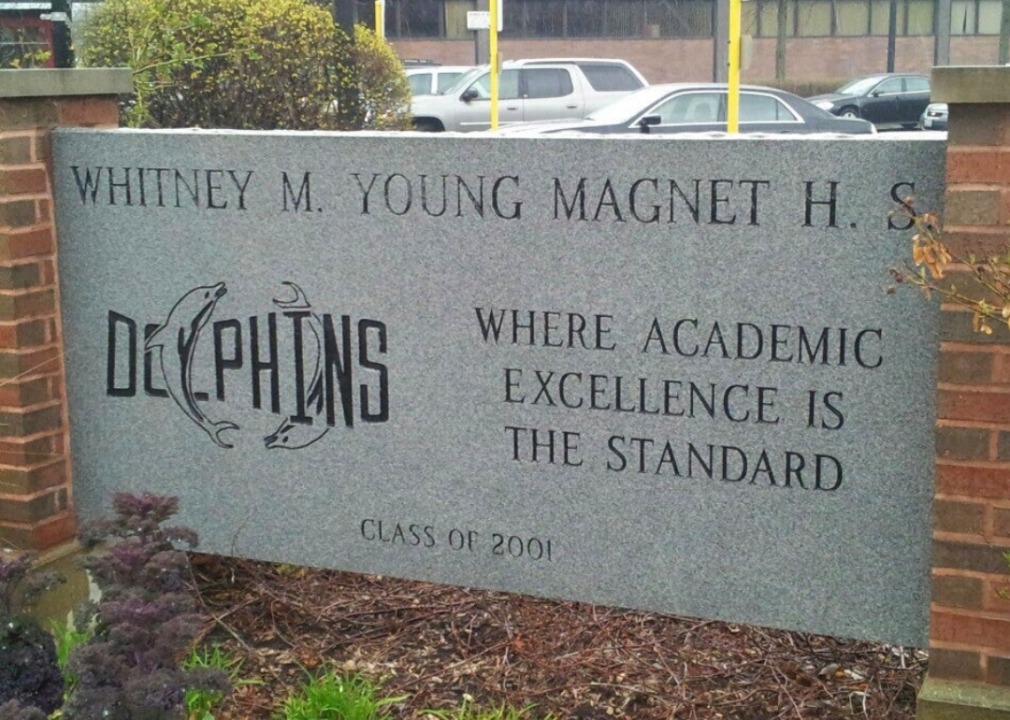
#27. Whitney M. Young Magnet High School
– Location: Chicago, IL
– Grades offered: 7-12
– Students: 2,153 (54% female; 46% male)
– Racial composition: 30.0% Hispanic; 28.1% White; 21.4% Black; 15.9% Asian
– Student-teacher ratio: 19:1
– Academic achievement:
— Reading proficient: 91%
— Math proficient: 91%
— AP enrollment: 59%

Canva
#26. OCVTS – Marine Academy of Technology & Environmental Science (MATES)
– Location: Manahawkin, NJ
– Grades offered: 9-12
– Students: 275 (55% female; 45% male)
– Racial composition: 78.2% White; 12.0% Asian; 5.5% Hispanic; 2.9% Multiracial
– Student-teacher ratio: 12:1
– Academic achievement:
— Reading proficient: 95%
— Math proficient: 95%
— AP enrollment: unavailable
You may also like: The best streaming services for sports in 2021
Monkey Business Images // Shutterstock
#25. School of Science & Engineering
– Location: Dallas, TX
– Grades offered: 9-12
– Students: 497 (34% female; 66% male)
– Racial composition: 60.0% Hispanic; 14.1% Asian; 13.5% White; 10.3% Black
– Student-teacher ratio: 19:1
– Academic achievement:
— Reading proficient: 95%
— Math proficient: 100%
— AP enrollment: 99%
B Brown // Shutterstock
#24. Oklahoma School of Science and Mathematics
– Location: Oklahoma City, OK
– Grades offered: 11-12
– Students: 150 (50% female; 50% male)
– Student-teacher ratio: 6:1

cozyta // Shutterstock
#23. Jericho Senior High School
– Location: Jericho, NY
– Grades offered: 9-12
– Students: 1,114 (47% female; 53% male)
– Racial composition: 56.3% Asian; 38.4% White; 3.1% Hispanic; 2.0% Black
– Student-teacher ratio: 10:1
– Academic achievement:
— Reading proficient: 99%
— Math proficient: 99%
— AP enrollment: 57%
Jellybean100 // Wikimedia Commons
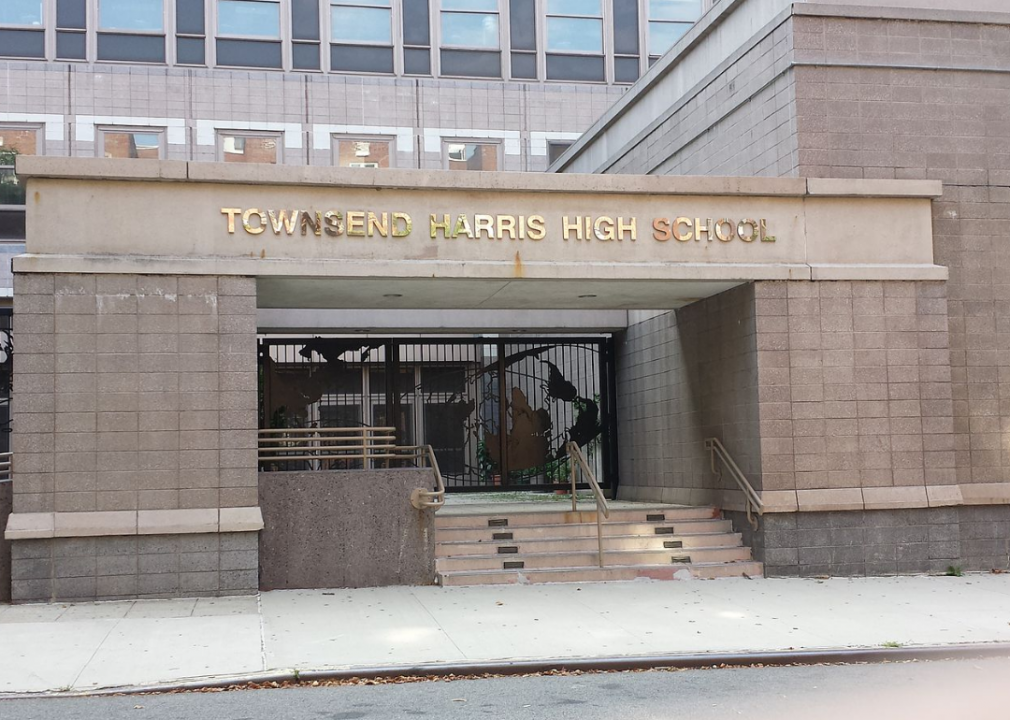
#22. Townsend Harris High School
– Location: Flushing, NY
– Grades offered: 9-12
– Students: 1,183 (68% female; 32% male)
– Racial composition: 55.3% Asian; 19.4% White; 12.3% Hispanic; 6.4% Multiracial
– Student-teacher ratio: 21:1
– Academic achievement:
— Reading proficient: 99%
— Math proficient: 99%
— AP enrollment: 90%
Michael Barera // Wikimedia Commons
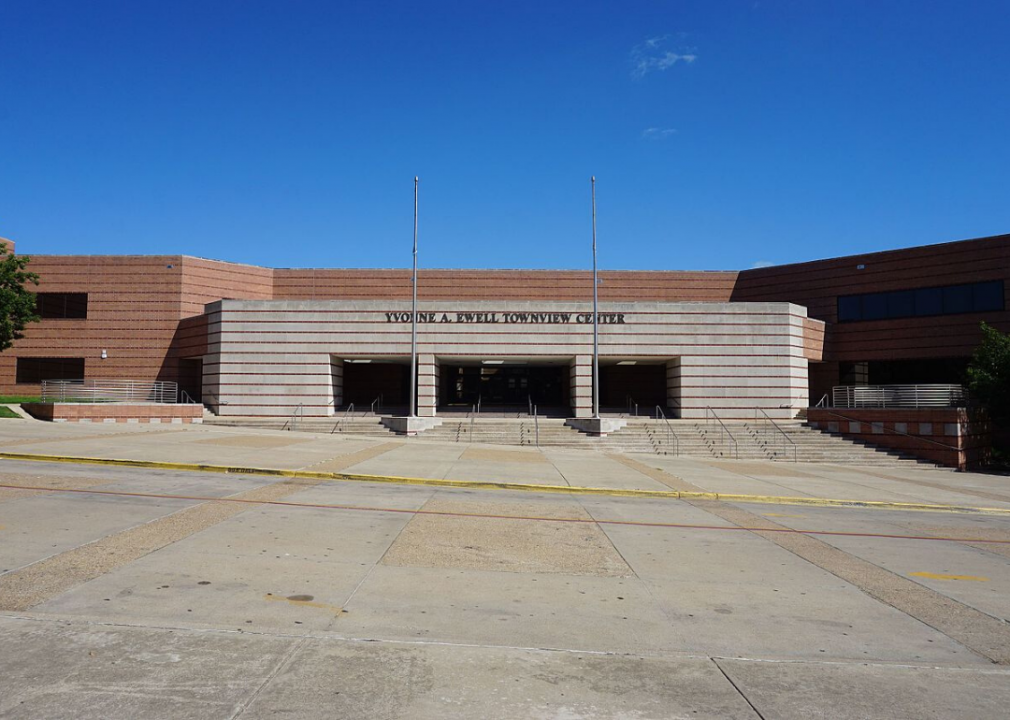
#21. School for the Talented & Gifted
– Location: Dallas, TX
– Grades offered: 9-12
– Students: 359 (58% female; 42% male)
– Racial composition: 38.7% Hispanic; 29.8% White; 17.3% Asian; 9.7% Black
– Student-teacher ratio: 19:1
– Academic achievement:
— Reading proficient: 90%
— Math proficient: 95%
— AP enrollment: 100%
[Pictured: Yvonne A. Ewell Townview Magnet Center, which houses the school.]
You may also like: Best value private colleges in America
B Brown // Shutterstock
#20. Biotechnology High School
– Location: Freehold, NJ
– Grades offered: 9-12
– Students: 317 (53% female; 47% male)
– Racial composition: 50.8% Asian; 42.6% White; 3.2% Multiracial; 1.6% Hispanic
– Student-teacher ratio: 12:1
– Academic achievement:
— Reading proficient: 98%
— Math proficient: 95%
— AP enrollment: 9%

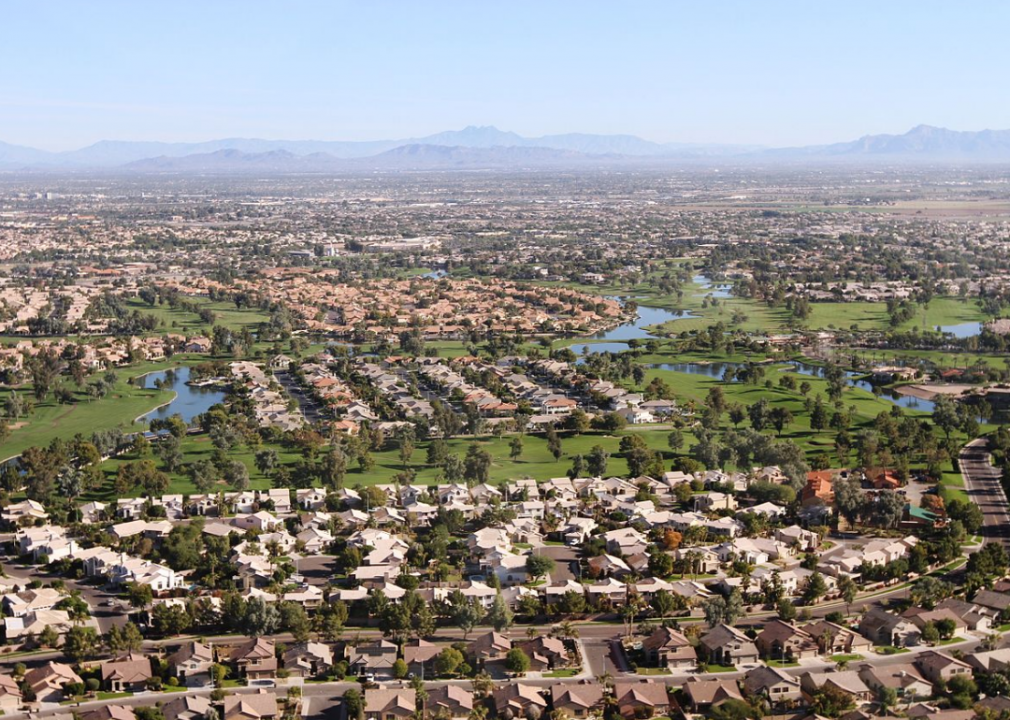
Jazmine Thomas // Shutterstock
#19. BASIS Scottsdale
– Location: Scottsdale, AZ
– Grades offered: 5-12
– Students: 1,081 (46% female; 54% male)
– Racial composition: 48.3% Asian; 39.0% White; 6.2% Hispanic; 4.7% Multiracial
– Student-teacher ratio: 11:1
– Academic achievement:
— Reading proficient: 88%
— Math proficient: 92%
— AP enrollment: 95%
Henry de Saussure Copeland // Flickr
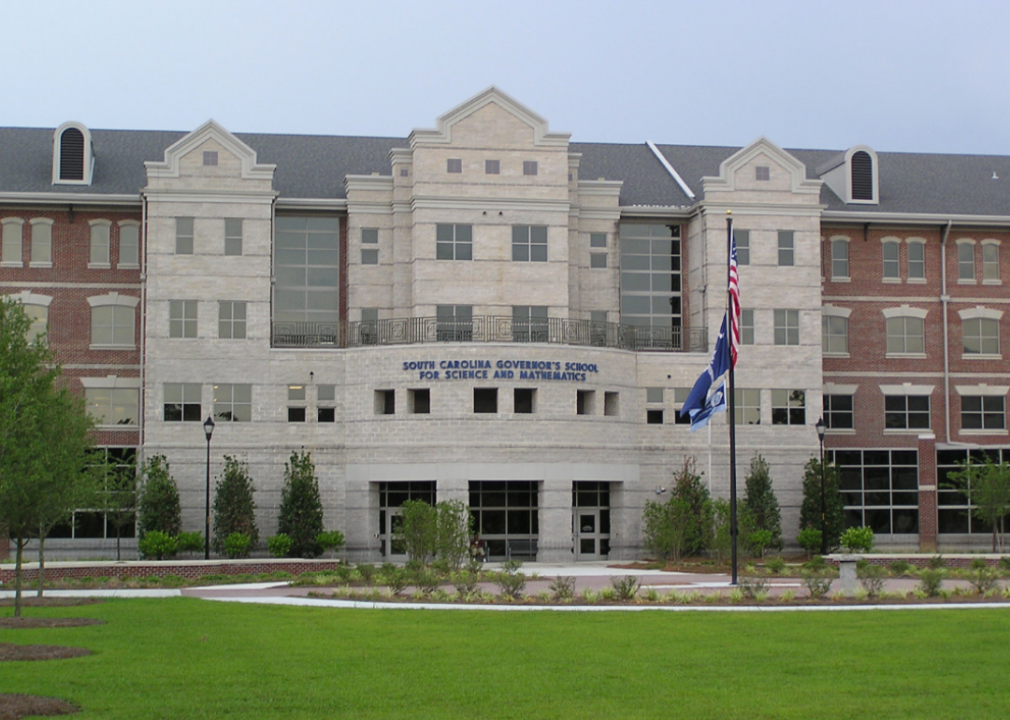
#18. South Carolina Governor’s School for Science & Mathematics
– Location: Hartsville, SC
– Grades offered: 11-12
– Students: 280 (51% female; 49% male)
– Racial composition: 65.0% White; 15.7% Asian; 12.5% Black; 6.1% Hispanic
– Student-teacher ratio: 13:1
– Academic achievement:
— Reading proficient: 95%
— Math proficient: 95%
— AP enrollment: 100%
Tonyhawkwiz // Wikimedia Commons
#17. Adlai E. Stevenson High School
– Location: Lincolnshire, IL
– Grades offered: 9-12
– Students: 4,261 (48% female; 52% male)
– Racial composition: 54.7% White; 32.1% Asian; 8.1% Hispanic; 2.9% Multiracial
– Student-teacher ratio: 15:1
– Academic achievement:
— Reading proficient: 78%
— Math proficient: 81%
— AP enrollment: 50%
Thomson200 // Wikimedia Commons
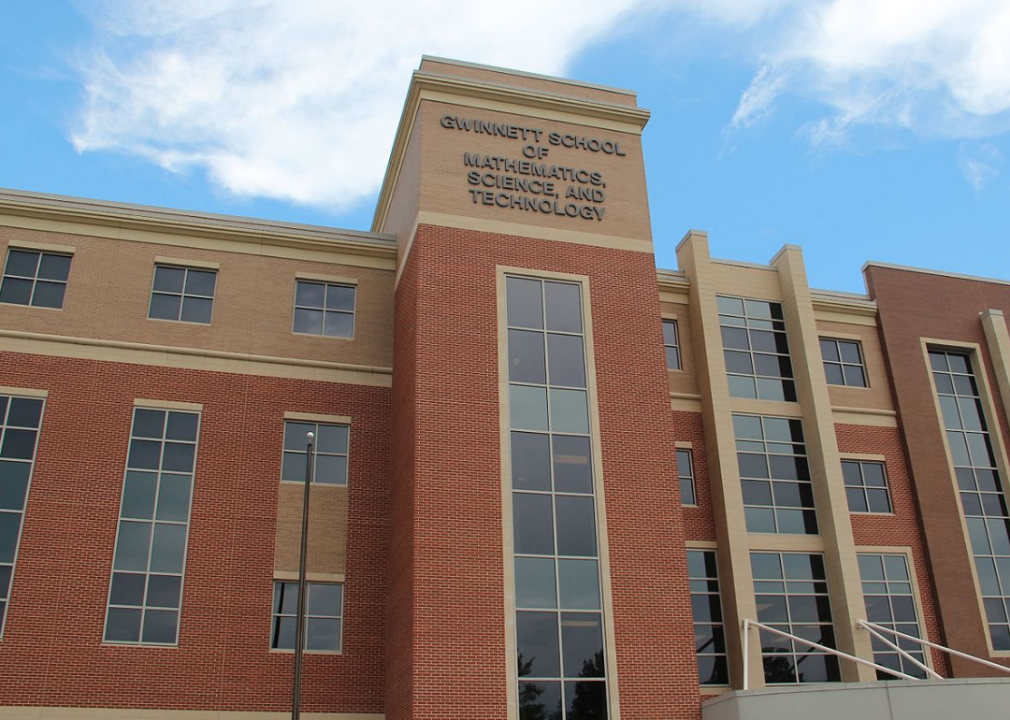
#16. Gwinnett School of Mathematics, Science & Technology
– Location: Lawrenceville, GA
– Grades offered: 9-12
– Students: 1,098 (46% female; 54% male)
– Racial composition: 45.8% Asian; 22.1% Black; 17.8% White; 10.2% Hispanic
– Student-teacher ratio: 17:1
– Academic achievement:
— Reading proficient: 95%
— Math proficient: 99%
— AP enrollment: 68%
You may also like: Most and least educated states in America
Bxsstudent // Wikimedia Commons
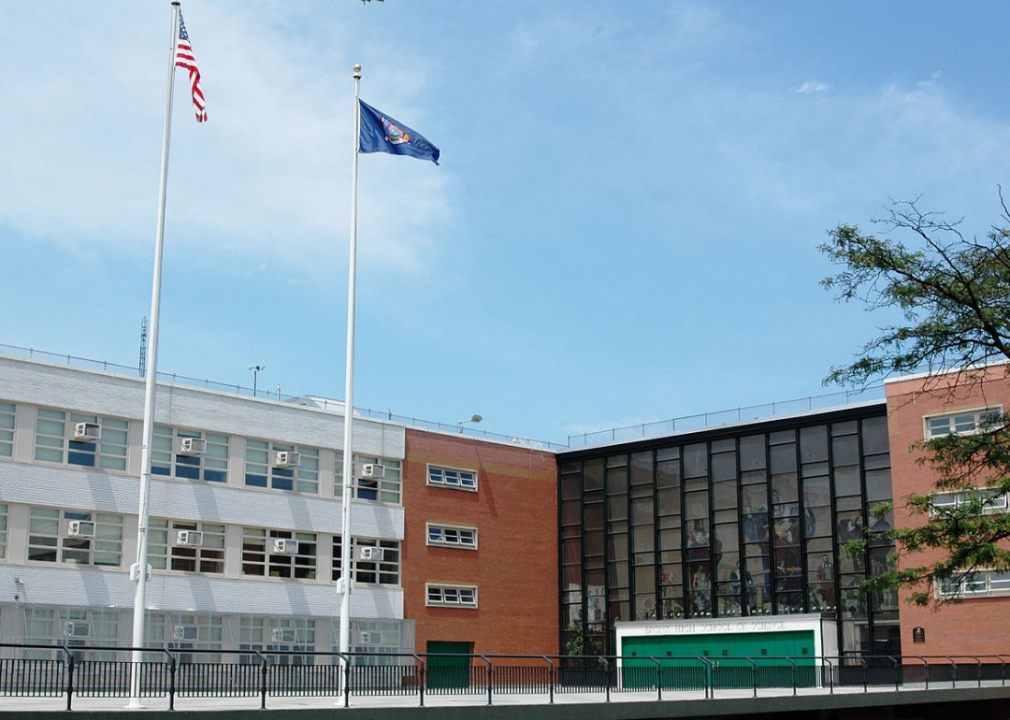
#15. Bronx High School of Science
– Location: Bronx, NY
– Grades offered: 9-12
– Students: 3,020 (41% female; 59% male)
– Racial composition: 64.0% Asian; 22.3% White; 7.1% Hispanic; 2.6% Black
– Student-teacher ratio: 21:1
– Academic achievement:
— Reading proficient: 99%
— Math proficient: 99%
— AP enrollment: 69%

Canva
#14. Liberal Arts & Science Academy
– Location: Austin, TX
– Grades offered: 9-12
– Students: 1,239 (49% female; 51% male)
– Racial composition: 50.2% White; 21.3% Asian; 20.6% Hispanic; 6.0% Multiracial
– Student-teacher ratio: 16:1
– Academic achievement:
— Reading proficient: 99%
— Math proficient: 99%
— AP enrollment: 76%

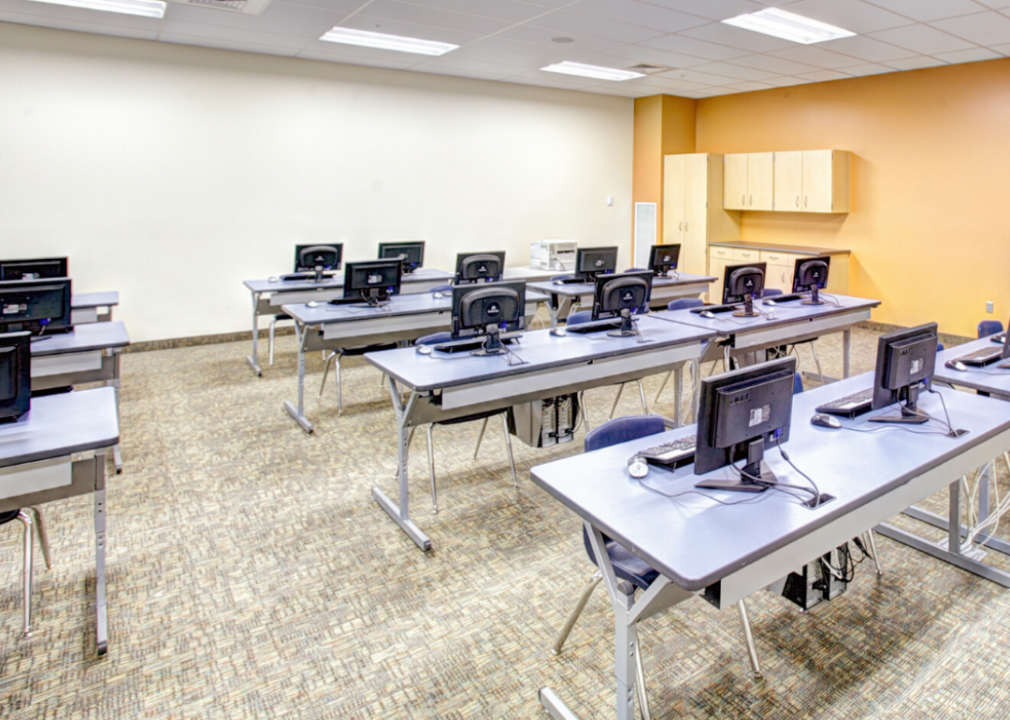
dotshock // Shutterstock
#13. Staten Island Technical High School
– Location: Staten Island, NY
– Grades offered: 9-12
– Students: 1,332 (44% female; 56% male)
– Racial composition: 49.7% Asian; 42.0% White; 5.0% Multiracial; 2.1% Hispanic
– Student-teacher ratio: 21:1
– Academic achievement:
— Reading proficient: 99%
— Math proficient: 99%
— AP enrollment: 95%
B Brown // Shutterstock
#12. The Mississippi School for Mathematics and Science
– Location: Columbus, MS
– Grades offered: 11-12
– Students: 238 (61% female; 39% male)
– Racial composition: 57.1% White; 24.4% Black; 14.7% Asian; 2.1% Multiracial
– Student-teacher ratio: 11:1
– Academic achievement:
— Reading proficient: 100%
— Math proficient: 100%
— AP enrollment: 78%

SINITAR // Shutterstock
#11. Northside College Preparatory High School
– Location: Chicago, IL
– Grades offered: 9-12
– Students: 1,090 (54% female; 46% male)
– Racial composition: 29.8% Hispanic; 26.9% White; 20.3% Asian; 14.1% Multiracial
– Student-teacher ratio: 18:1
– Academic achievement:
— Reading proficient: 97%
— Math proficient: 93%
— AP enrollment: 60%
You may also like: The best streaming services for football in 2021

Canva
#10. High Technology High School
– Location: Lincroft, NJ
– Grades offered: 9-12
– Students: 286 (35% female; 65% male)
– Racial composition: 55.2% Asian; 35.7% White; 3.5% Multiracial; 2.8% Black
– Student-teacher ratio: 12:1
– Academic achievement:
— Reading proficient: 99%
— Math proficient: 95%
— AP enrollment: 33%
Foursquare
#9. Walter Payton College Prep
– Location: Chicago, IL
– Grades offered: 9-12
– Students: 1,153 (55% female; 45% male)
– Racial composition: 43.6% White; 22.3% Hispanic; 17.4% Asian; 10.8% Black
– Student-teacher ratio: 18:1
– Academic achievement:
— Reading proficient: 99%
— Math proficient: 97%
— AP enrollment: 76%
Jauerback // Wikimedia Commons
#8. Illinois Mathematics and Science Academy
– Location: Aurora, IL
– Grades offered: 10-12
– Students: 647 (50% female; 50% male)
– Racial composition: 43.0% Asian; 37.1% White; 7.7% Hispanic; 7.0% Black
– Student-teacher ratio: 12:1

milatas // Shutterstock
#7. The Davidson Academy
– Location: Reno, NV
– Grades offered: 5-12
– Students: 189 (49% female; 51% male)
– Racial composition: 61.4% White; 33.3% Asian; 3.2% Hispanic; 1.6% Black
– Student-teacher ratio: 5:1
– Academic achievement:
— Reading proficient: 95%
— Math proficient: 95%
— AP enrollment: unavailable
Tdorante10 // Wikimedia Commons
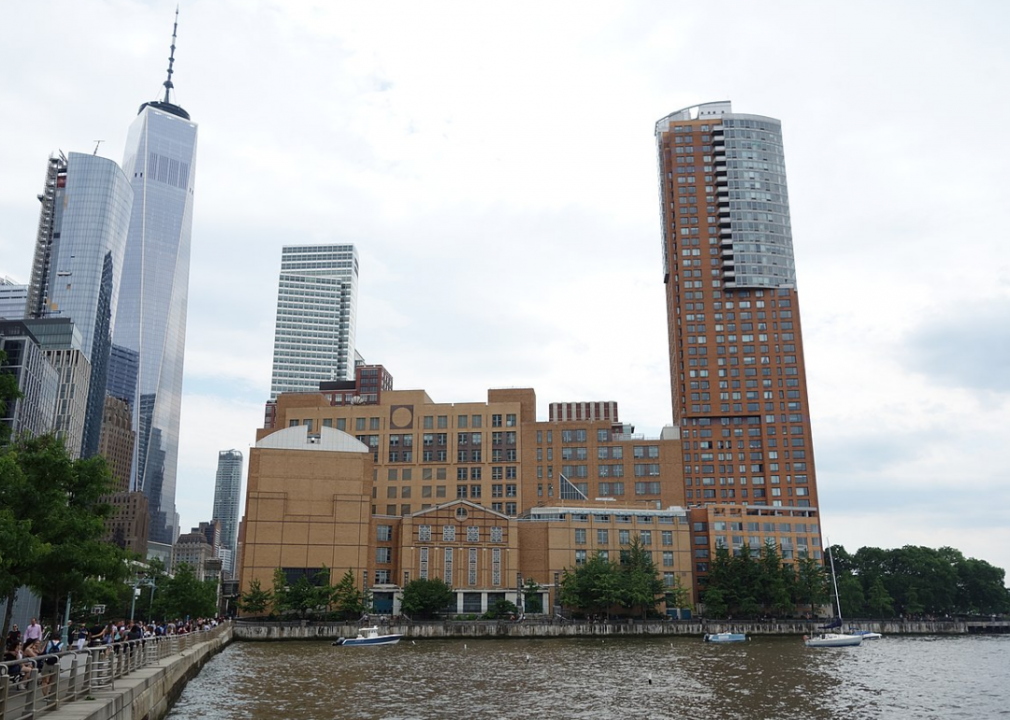
#6. Stuyvesant High School
– Location: New York, NY
– Grades offered: 9-12
– Students: 3,319 (43% female; 57% male)
– Racial composition: 72.6% Asian; 18.9% White; 3.6% Multiracial; 3.0% Hispanic
– Student-teacher ratio: 21:1
– Academic achievement:
— Reading proficient: 99%
— Math proficient: 99%
— AP enrollment: 56%
You may also like: Best community college in every state
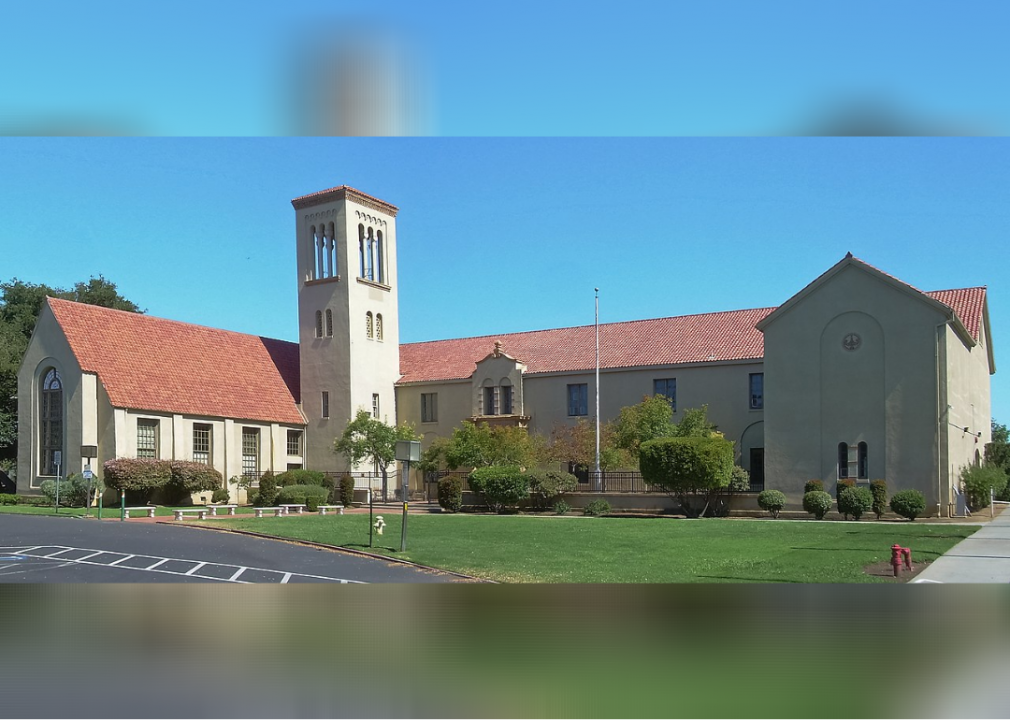
MTK4RVA // Wikimedia Commons
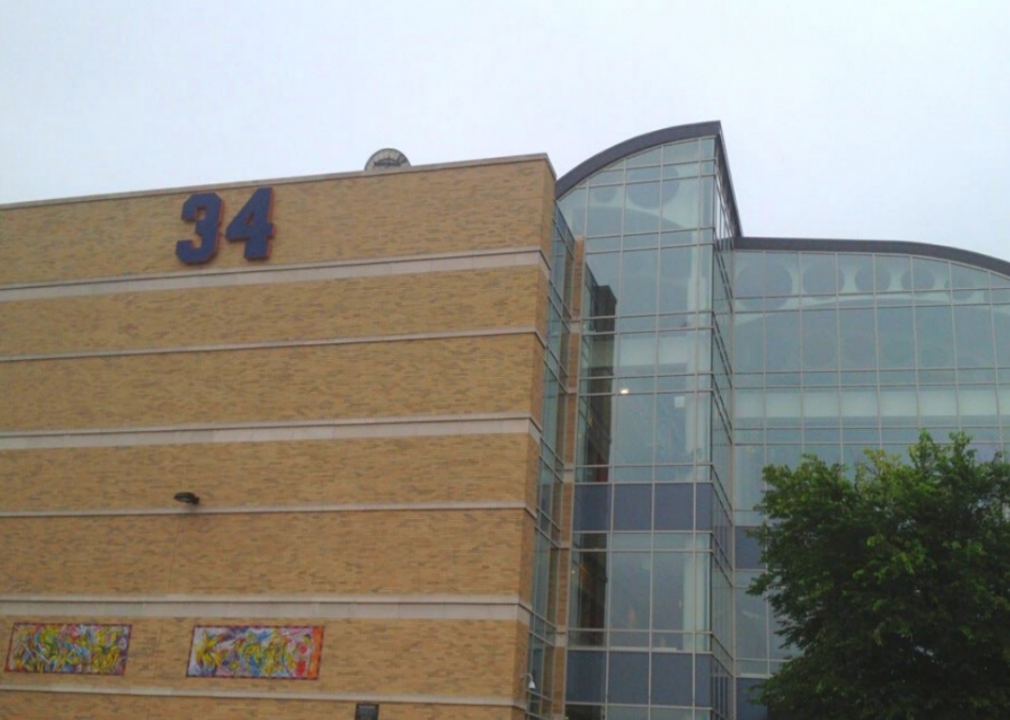
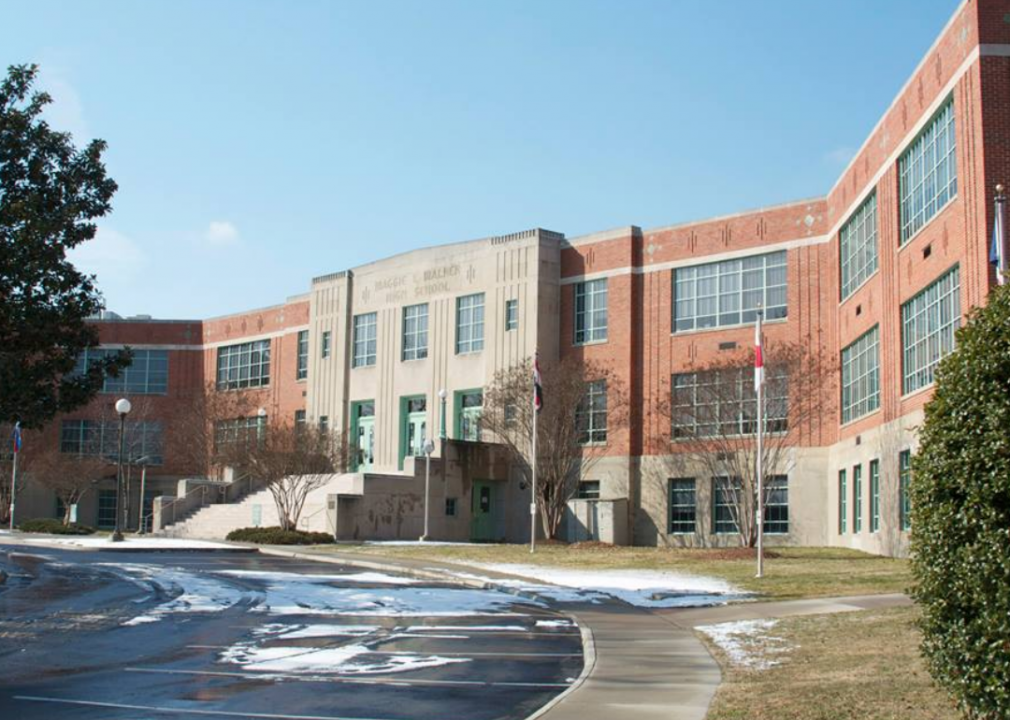
#5. Maggie Walker Governor’s School
– Location: Richmond, VA
– Grades offered: 9-12
– Students: 746 (58% female; 42% male)
– Student-teacher ratio: 15:1
– Academic achievement:
— Reading proficient: 100%
— Math proficient: 100%
— AP enrollment: 66%
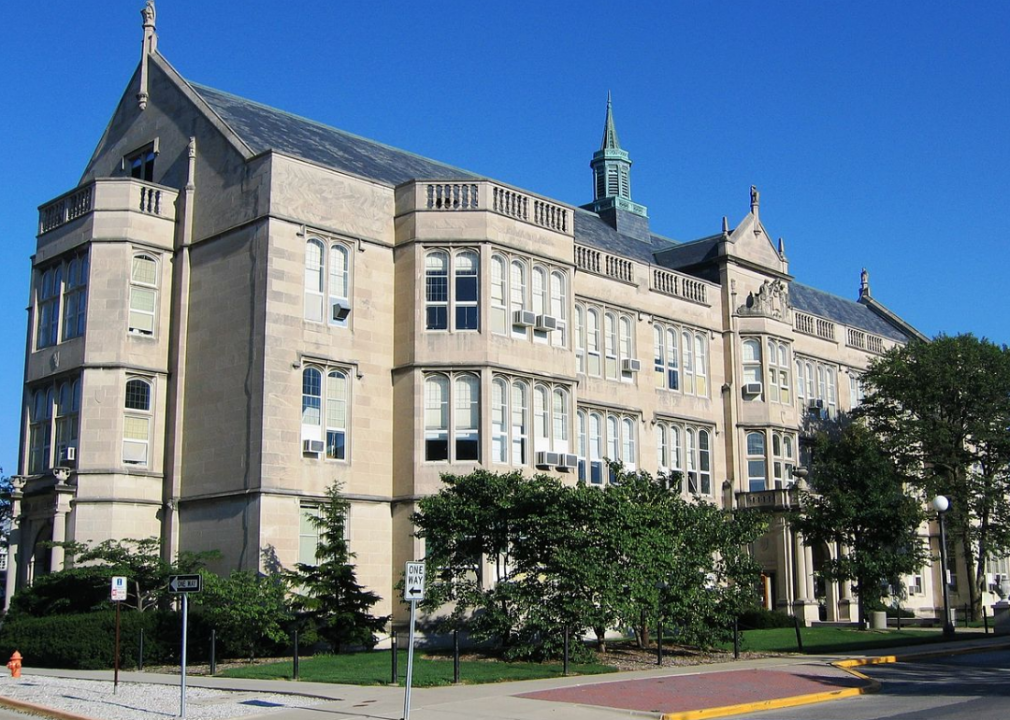
Ildar Sagdejev // Wikimedia Commons
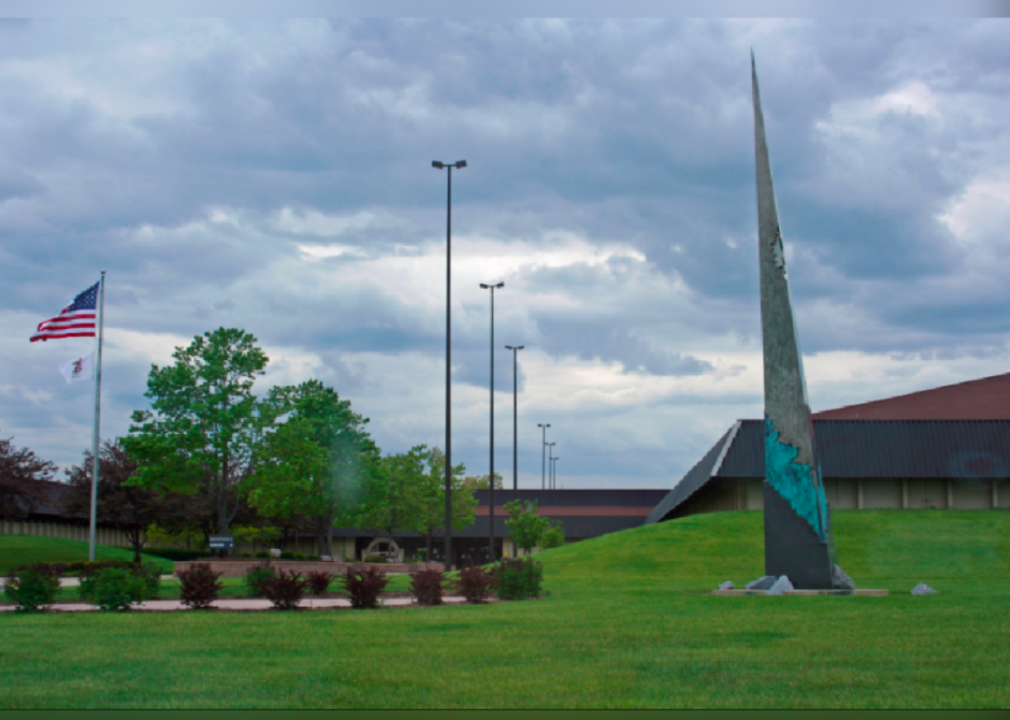
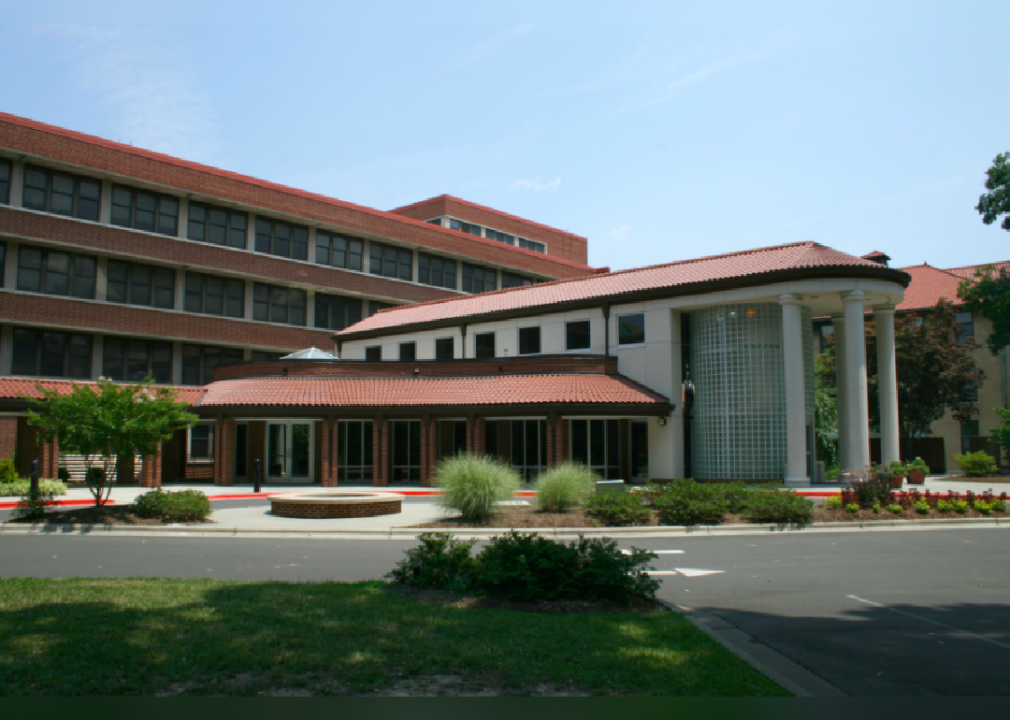
#4. North Carolina School of Science and Mathematics
– Location: Durham, NC
– Grades offered: 11-12
– Students: 680
– Student-teacher ratio: 7:1

Office of Naval Research // Wikimedia Commons
#3. Thomas Jefferson High School for Science & Technology
– Location: Alexandria, VA
– Grades offered: 9-12
– Students: 1,781 (41% female; 59% male)
– Racial composition: 70.2% Asian; 20.5% White; 4.9% Multiracial; 2.4% Hispanic
– Student-teacher ratio: 18:1
– Academic achievement:
— Reading proficient: 99%
— Math proficient: 99%
— AP enrollment: 73%
John Phelan // Wikimedia Commons
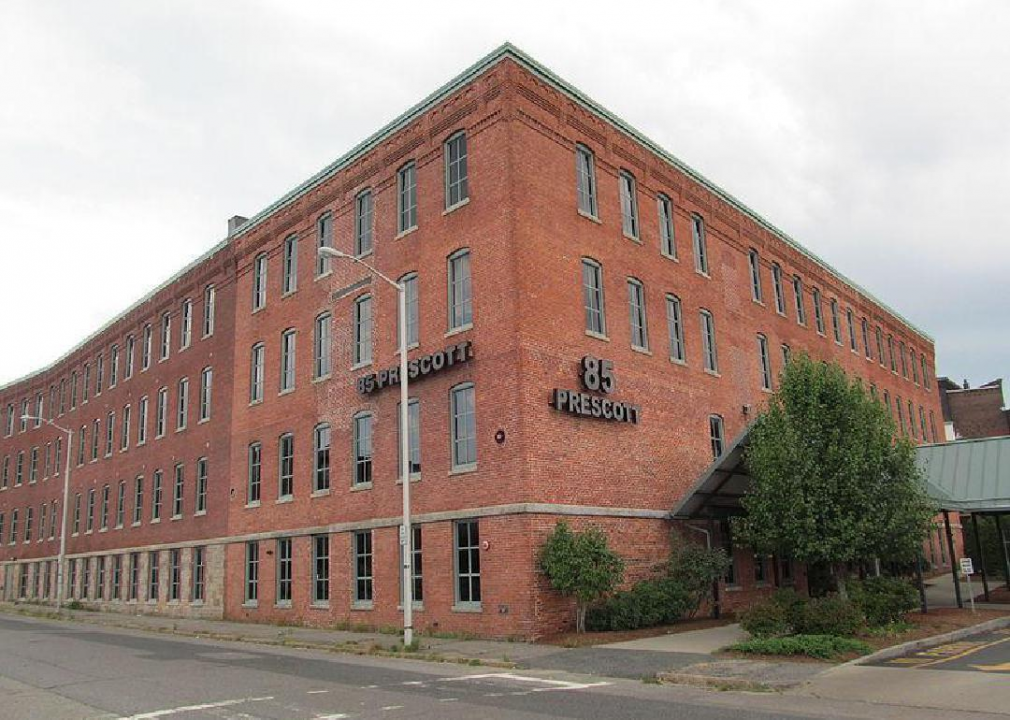
#2. Massachusetts Academy of Math & Science
– Location: Worcester, MA
– Grades offered: 11-12
– Students: 98 (47% female; 53% male)
– Racial composition: 50.0% Asian; 35.7% White; 8.2% Multiracial; 4.1% Hispanic
– Student-teacher ratio: 16:1

Canva
#1. Bergen County Academies
– Location: Hackensack, NJ
– Grades offered: 9-12
– Students: 1,098 (52% female; 48% male)
– Racial composition: 51.4% Asian; 37.8% White; 7.7% Hispanic; 2.4% Black
– Student-teacher ratio: 11:1
– Academic achievement:
— Reading proficient: 98%
— Math proficient: 99%
— AP enrollment: 47%
You may also like: 50 best colleges on the East Coast