Best and worst states for health care

Canva
Best and worst states for health care
An aerial view of Honolulu, Hawaii.
Access to health care services and the affordability of health insurance are crucial to overall health but vary widely across the United States. MoneyGeek analyzed a host of statistics, from health outcomes — such as preventable deaths and rates of certain diseases or risk factors — to health access and cost — such as how many people are uninsured and have affordable health insurance options available — to find the best and worst states for health care in the U.S.
SUMMARY FINDINGS:
- Hawaii is the top state for health care in the U.S. It has the best health outcomes in the country, with low preventable death (47 per 100,000 people), diabetes mortality and obesity rates. However, the state ranks fairly low for accessibility (No. 31).
- West Virginia has the worst health care in the nation. Though West Virginia ranks No. 6 for accessibility, it has the worst health outcomes of any state, with the highest rate of preventable deaths (126 preventable deaths among 100,000 residents) and diabetes mortalities. It also has the highest average private health insurance premiums ($8,546 per year) in the U.S.
- Vermont is the most expensive state for health care. The state has the third-highest annual private health care premiums in the country (averaging $7,886) and government spending on per capita health care costs at nearly $6,000. Vermont spends more than 13% of its total gross domestic product (GDP) on health care, while the national average is around 9%.
- Maryland has the lowest annual private health insurance premiums of any state ($4,052, on average). The national average annual cost across all states in the U.S. is $5,752.
![]()
MoneyGeek
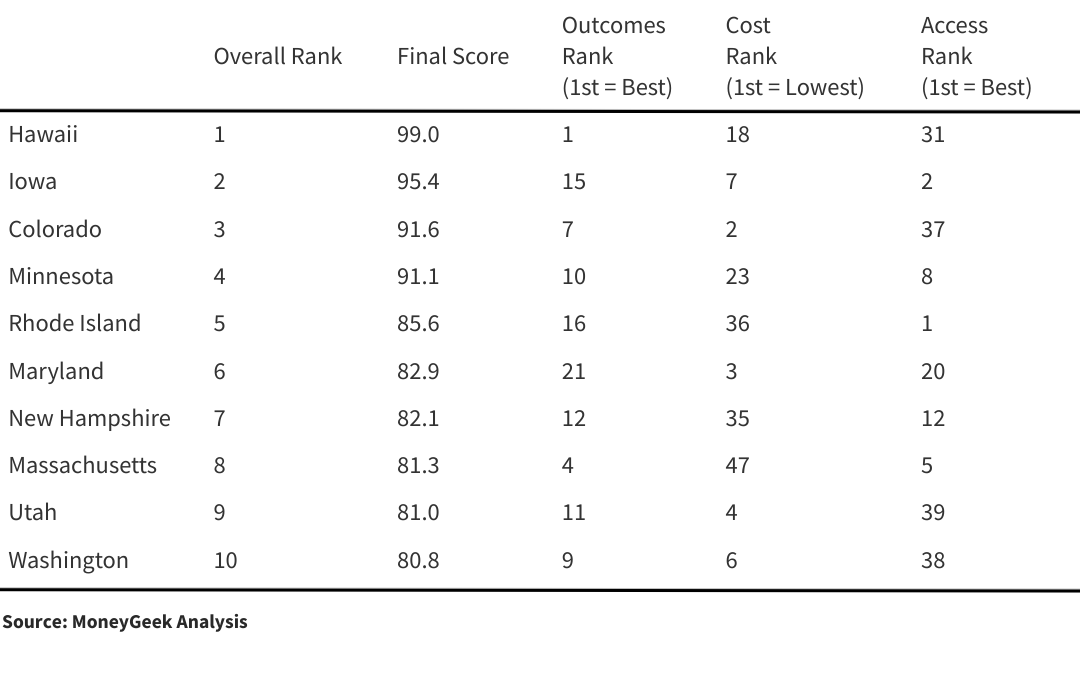
The 10 states with the best health care
The states with the best health care in the United States are those where people are generally healthier, have access to health care services and are less likely to be uninsured. The best states for health care are found all across the country, from Hawaii to Rhode Island. That said, 4 of the top 10 states on our list are located in the Northeast.
MoneyGeek
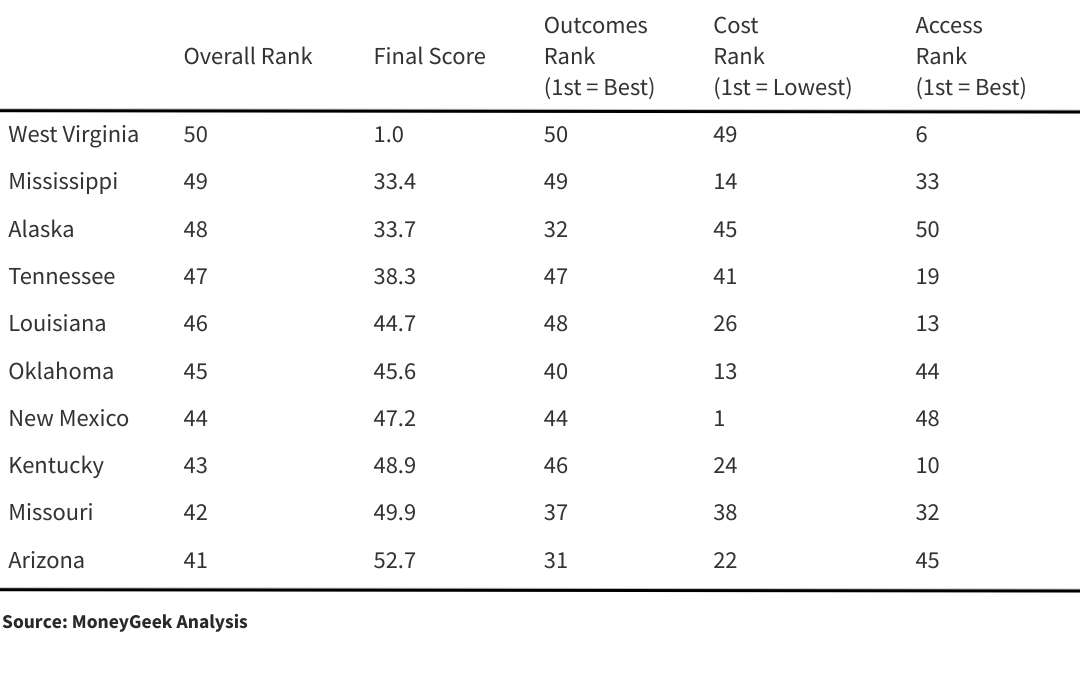
The 10 states with the lowest rank for health care
States that fare worse on our health care rankings tend to have higher costs for less access and higher rates of medical conditions like diabetes and obesity. The worst states for health care are concentrated regionally, with 8 of the 10 clustered in the South and Southeast.

Canva
Additional findings: Outcome, cost and access data rankings
An aerial view of Montpelier, Vermont at dusk.
To evaluate health care in the United States, MoneyGeek looked at three categories of data that together create a comprehensive view of the overall quality of health care in each location. Those categories include:
- Health outcomes, including indicators such as rates of disease and risk factors like obesity and smoking, preventable deaths and infant mortality. These measures help answer the question: How healthy are the people who live here?
- Cost, including factors like how much the state spends on health care and the average cost of private health insurance. These measures help answer the question: How expensive is health care in this state?
- Access, including data on the number of primary care providers and hospital beds available, how many people are uninsured and how many people needed care but had difficulty getting it. These indicators help answer the question: How easy is it to get the health care you need in this state?
Within these three categories, we broke down the best and the worst states across a wide range of health care outcome, cost and access data points. Below is a brief summary of those findings, along with the top best and worst states for each data point.
Deep Blue States Across the US Have the Healthiest Residents
- Best States for Health Outcomes:
1. Hawaii
2. Vermont
3. California
4. Massachusetts
5. New York
- Worst States for Health Outcomes:
1. West Virginia
2. Mississippi
3. Louisiana
4. Tennessee
5. Kentucky
Southern States Have Highest Diabetes Mortality Rates
- States With Fewest Diabetes Mortalities per 100,000 Residents:
1. Hawaii: 17.0
2. Massachusetts: 17.2
3. Connecticut: 17.5
4. Vermont: 17.5
5. Colorado: 18.0
- States With Most Diabetes Mortalities per 100,000 Residents:
50. West Virginia: 41.3
49. Mississippi: 41.0
48. Arkansas: 33.8
47. Louisiana: 33.1
46. Oklahoma: 32.8
West Virginia’s Preventable Death Rate Is Nearly Three Times Texas’s
- States With the Lowest Rates of Preventable Deaths per 100,000 Residents:
1. Texas: 44.0
2. Utah: 45.0
3. New York: 45.3
4. Hawaii: 46.5
5. Nebraska: 46.6
- States With the Highest Rates of Preventable Deaths per 100,000 Residents:
50. West Virginia: 125.6
49. Tennessee: 88.7
48. Kentucky: 88.2
47. New Mexico: 88.0
46. Maine: 85.1
Northeast States Have Two Times the Primary Care Providers of Western States
- States With the Most Primary Care Providers per 100,000 Residents:
1. Rhode Island: 255.1
2. Massachusetts: 227.7
3. New York: 207.4
4. Connecticut: 197.8
5. Pennsylvania: 197.0
- States With the Fewest Primary Care Providers per 100,000 Residents:
50. Utah: 98.7
49. Idaho: 99.2
48. Nevada: 101.6
47. Texas: 109.0
46. Montana: 110.3

Canva
Depending on state, Americans’ cost for care can vary significantly
An aerial view of Albuquerque, New Mexico at sunset.
Overall Affordability Is Best in the Southwest, Worst in the Northeast
- States With Most Affordable Health Care:
1. New Mexico
2. Colorado
3. Maryland
4. Utah
5. South Carolina
- States With Least Affordable Health Care:
50. Vermont
49. West Virginia
48. New York
47. Massachusetts
46. New Jersey
Health Insurance Is Nearly Two Times as Expensive in Worst States for Costs
- States With Lowest Average Cost of Private Health Insurance:
1. Maryland: $4,052
2. New Mexico: $4,063
3. Minnesota: $4,109
4. Michigan: $4,335
5. Colorado: $4,368
- States With Highest Average Cost of Private Health Insurance:
50. West Virginia: $8,546
49. New York: $8,501
48. Vermont: $7,886
47. Wyoming: $7,646
46. New Jersey: $7,000
Northeast States Have Lowest Uninsured Rates; Southern States, Highest
- States With Lowest Uninsured Population Rate:
1. Massachusetts: 3.0%
2. Rhode Island: 4.1%
3. Hawaii: 4.2%
4. Vermont: 4.5%
5. Minnesota: 4.9%
- States With Highest Uninsured Population Rate:
50. Texas: 18.4%
49. Oklahoma: 14.3%
48. Georgia: 13.4%
47. Florida: 13.2%
46. Mississippi: 13.0%

Tada Images // Shutterstock
Methodology
The headquarters of the Centers for Disease Control and Prevention in Atlanta, Georgia.
To explore and rank health care quality by state, MoneyGeek analyzed three core categories — health outcomes, cost and access to care — using health care data from the Kaiser Family Foundation, the Centers for Disease Control and HealthData.gov. We assigned weights to each factor within these core categories to measure health care quality.
Outcome Factor Rank: Based on cumulative scores across the following factors:
- Infant mortality rate: The number of infant deaths per 1,000 live births
- Preventable death rate: Deaths that can be avoided through effective preventative health care and interventions per 100,000 residents
- Diabetes mortality rate: Deaths attributed to diabetes per 100,000 residents
- Obesity: Percentage of population considered obese
- Smoking rate: Percentage of adults who reported smoking
- Life expectancy: The average number of years a person can expect to live
- Suicide rates: Suicide deaths among persons age 12 and over per 100,000 residents
- New HIV cases per 100,000 residents over the age of 13
- Opioid-related hospital stay rate: Inpatient hospital stays involving opioid-related diagnoses per 100,000 residents
- Cost Factor Rank: Based on cumulative scores across the following factors:
- Health care spending as a percentage of state GDP: Government spending on health care and social assistance out of total state GDP
- State government spending on health care and social assistance per resident
- Average annual private health insurance premium costs
- Access Factor Rank: Based on cumulative score across the following factors:
- Number of hospital beds per 1,000 residents
- Number of primary care providers per 100,000 residents
- Primary care provider shortage areas (HPSAs) by state: Designations that identify areas of the U.S. experiencing health care professional shortages
- Percentage of population with access to any insurance versus just health insurance
- Ease of access to care at the doctor’s office or clinic using Medicare
- Ease of access to care at a specialist using Medicare
MoneyGeek used the following weightings in our analysis:
- Preventable death rate: Full weight
- Infant mortality rate: Full weight
- Life expectancy: Half weight
- Diabetes mortalities per 100,000 people: Half weight
- Obesity as a percentage of the population: Half weight
- Hospital inpatient stays involving opioid-related diagnoses per 100,00 people: Quarter weight
- Smoking rate among adults: Quarter weight
- Suicide deaths among persons ages 12 and older per 100,000 people: Quarter weight
- New HIV cases among persons ages 13 and older per 100,000 people: Quarter weight
- Annual health insurance costs: Full weight
- Health care spending as a percentage of state GDP: Half weight
- Health care spending as a share of GDP per resident: Half weight
- Percentage of population with health insurance: Full weight
- Number of hospital beds per 100,000 people: Half weight
- Adults who had a doctor’s office or clinic visit in the last 12 months and needed care, tests, or treatment who sometimes or never found it easy to get the care, tests, or treatment, Medicare fee-for-service: Quarter weight
- Adults who needed to see a specialist in the last 6 or 12 months who sometimes or never found it easy to see a specialist, Medicare fee-for-service: Quarter weight
- Primary care health professional shortage areas: % of need met to remove shortage designation: Quarter weight
- Number of primary care providers per 100,000 population: Quarter weight
SOURCES
- Dartmouth Atlas Project. “The Dartmouth Atlas of Health Care.” Accessed June 29, 2022.
- JAMA Network Open. “Quantification of Neighborhood-Level Social Determinants of Health in the Continental United States.” Accessed June 29, 2022.
This story originally appeared on MoneyGeek and has been independently reviewed to meet journalistic standards.