Counties with the highest rate of food insecurity in California
Cbl62 // Wikicommons
Counties with the highest rate of food insecurity in California
Every county in the United States is home to people experiencing food insecurity, defined by the nonprofit Feeding America as “a lack of consistent access to enough food for every person in a household to live an active, healthy life.”
The USDA estimates that 89.5% of U.S. households were food secure throughout 2019—that’s 116.0 million people. The COVID-19 pandemic put further strain on households already experiencing food hardship, with Feeding America estimating that 42 million people, or 1 in 8 Americans, may experience food insecurity in 2021. This is a slight improvement from 2020 numbers but still represents an enormous burden for millions of children and adults.
Stacker compiled a list of counties in California with the highest rate of food insecurity using data from Feeding America. Counties are ranked by highest percent of population with food insecurity as of 2019.
![]()

Hollywood // Wikimedia Commons
#50. Orange County
– Food insecurity rate: 8.3% (264,340 total)
— 23.9% lower than national average
– Child food insecurity rate: 10.1% (70,970 total)
— 30.8% lower than national average
– Annual food budget shortfall: $158,634,000
— Cost per meal: $3.51
Jennifer Williams // Wikimedia Commons
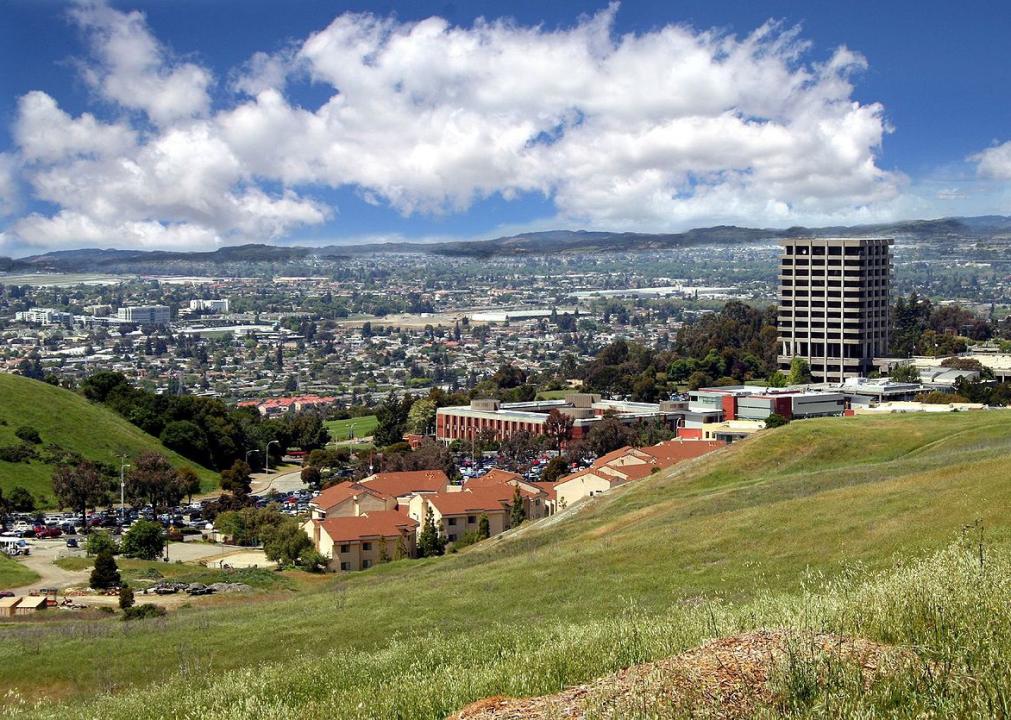
#49. Alameda County
– Food insecurity rate: 8.4% (139,810 total)
— 22.9% lower than national average
– Child food insecurity rate: 9.9% (34,040 total)
— 32.2% lower than national average
– Annual food budget shortfall: $95,592,000
— Cost per meal: $4.00

Canva
#48. Solano County
– Food insecurity rate: 8.5% (37,600 total)
— 22.0% lower than national average
– Child food insecurity rate: 13.3% (13,100 total)
— 8.9% lower than national average
– Annual food budget shortfall: $21,082,000
— Cost per meal: $3.28

clr_flickr from Rocklin, USA // Wikimedia Commons
#47. Mono County
– Food insecurity rate: 8.7% (1,240 total)
— 20.2% lower than national average
– Child food insecurity rate: 11.5% (310 total)
— 21.2% lower than national average
– Annual food budget shortfall: $675,000
— Cost per meal: $3.19
Fred Hsu // Wikicommons
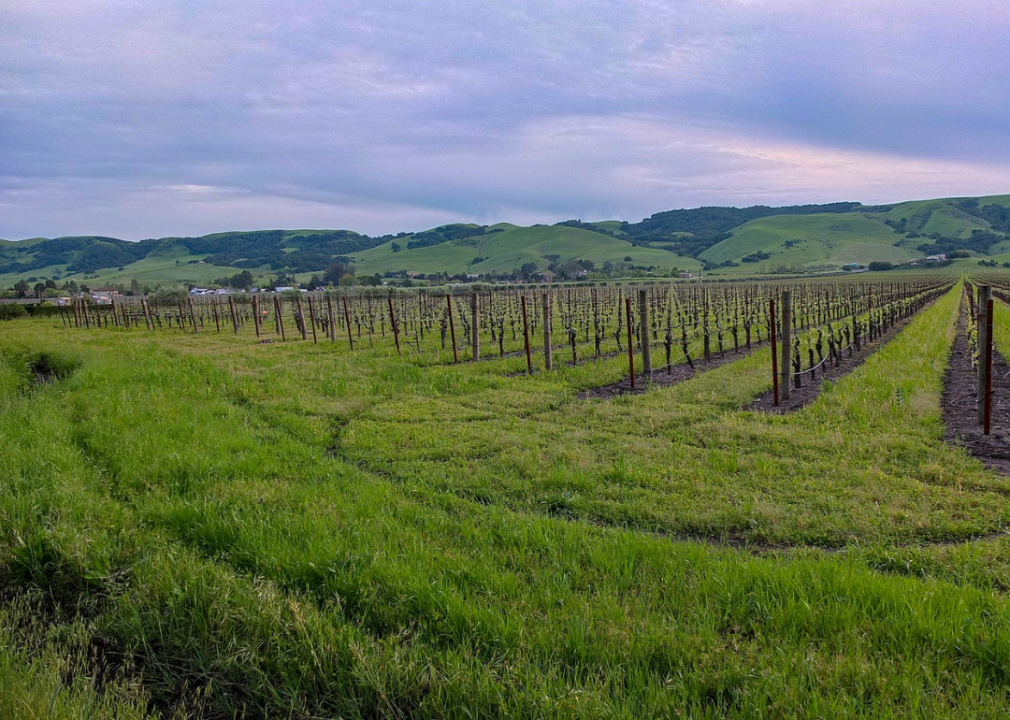
#46. Sonoma County
– Food insecurity rate: 8.7% (43,600 total)
— 20.2% lower than national average
– Child food insecurity rate: 10.3% (10,230 total)
— 29.5% lower than national average
– Annual food budget shortfall: $29,835,000
— Cost per meal: $4.00

DimiTalen // Wikimedia Commons
#45. El Dorado County
– Food insecurity rate: 9.0% (16,890 total)
— 17.4% lower than national average
– Child food insecurity rate: 11.5% (4,350 total)
— 21.2% lower than national average
– Annual food budget shortfall: $12,719,000
— Cost per meal: $4.41

Daniel Orth // Flickr
#44. Riverside County
– Food insecurity rate: 9.0% (216,050 total)
— 17.4% lower than national average
– Child food insecurity rate: 13.6% (83,430 total)
— 6.8% lower than national average
– Annual food budget shortfall: $117,000,000
— Cost per meal: $3.17

Basar // Wikicommons
#43. San Luis Obispo County
– Food insecurity rate: 9.1% (25,660 total)
— 16.5% lower than national average
– Child food insecurity rate: 10.7% (5,370 total)
— 26.7% lower than national average
– Annual food budget shortfall: $15,901,000
— Cost per meal: $3.62

Pixabay
#42. Santa Barbara County
– Food insecurity rate: 9.2% (41,030 total)
— 15.6% lower than national average
– Child food insecurity rate: 11.7% (11,640 total)
— 19.9% lower than national average
– Annual food budget shortfall: $23,899,000
— Cost per meal: $3.41

SD Dirk // Flickr
#41. San Diego County
– Food insecurity rate: 9.2% (305,100 total)
— 15.6% lower than national average
– Child food insecurity rate: 11.7% (84,370 total)
— 19.9% lower than national average
– Annual food budget shortfall: $180,727,000
— Cost per meal: $3.47

Canva
#40. San Bernardino County
– Food insecurity rate: 9.6% (206,710 total)
— 11.9% lower than national average
– Child food insecurity rate: 14.9% (85,080 total)
— 2.1% higher than national average
– Annual food budget shortfall: $110,278,000
— Cost per meal: $3.12

Chuck Abbe // Wikimedia Commons
#39. Inyo County
– Food insecurity rate: 10.0% (1,800 total)
— 8.3% lower than national average
– Child food insecurity rate: 12.6% (450 total)
— 13.7% lower than national average
– Annual food budget shortfall: $1,000,000
— Cost per meal: $3.25
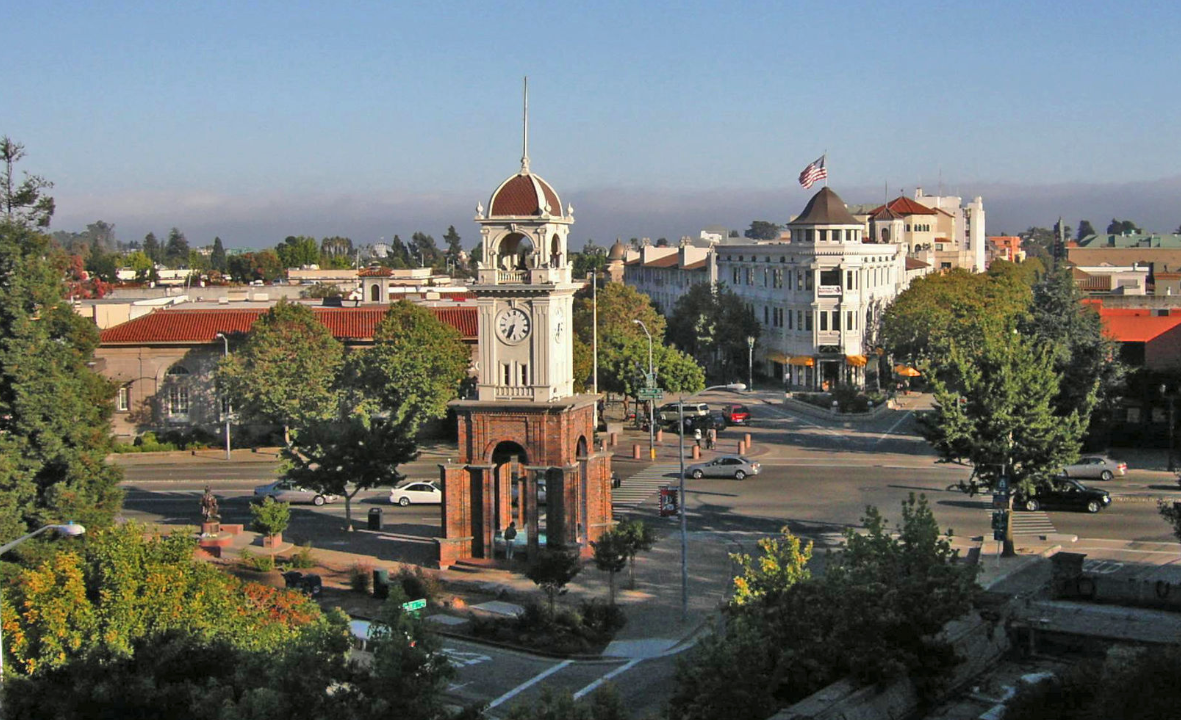
Aaronbrick // Wikicommons
#38. Santa Cruz County
– Food insecurity rate: 10.1% (27,710 total)
— 7.3% lower than national average
– Child food insecurity rate: 12.6% (6,700 total)
— 13.7% lower than national average
– Annual food budget shortfall: $19,442,000
— Cost per meal: $4.10

Naotake Murayama // Wikicommons
#37. Monterey County
– Food insecurity rate: 10.1% (43,610 total)
— 7.3% lower than national average
– Child food insecurity rate: 14.6% (16,650 total)
— 0.0% lower than national average
– Annual food budget shortfall: $25,646,000
— Cost per meal: $3.44

Frank Schulenburg // Wikimedia Commons
#36. Nevada County
– Food insecurity rate: 10.4% (10,310 total)
— 4.6% lower than national average
– Child food insecurity rate: 13.6% (2,330 total)
— 6.8% lower than national average
– Annual food budget shortfall: $8,745,000
— Cost per meal: $4.96

Canva
#35. San Francisco County
– Food insecurity rate: 10.5% (92,090 total)
— 3.7% lower than national average
– Child food insecurity rate: 8.7% (10,230 total)
— 40.4% lower than national average
– Annual food budget shortfall: $76,192,000
— Cost per meal: $4.84
Bobak Ha’Eri // Wikimedia Commons
#34. Amador County
– Food insecurity rate: 10.7% (4,120 total)
— 1.8% lower than national average
– Child food insecurity rate: 16.1% (940 total)
— 10.3% higher than national average
– Annual food budget shortfall: $2,920,000
— Cost per meal: $4.15

Epolk // Wikimedia Commons
#33. Yolo County
– Food insecurity rate: 10.7% (23,330 total)
— 1.8% lower than national average
– Child food insecurity rate: 12.7% (5,830 total)
— 13.0% lower than national average
– Annual food budget shortfall: $13,816,000
— Cost per meal: $3.46

BDS2006 // Wikimedia
#32. Los Angeles County
– Food insecurity rate: 10.7% (1,079,900 total)
— 1.8% lower than national average
– Child food insecurity rate: 14.5% (321,690 total)
— 0.7% lower than national average
– Annual food budget shortfall: $640,658,000
— Cost per meal: $3.47

Canva
#31. Sacramento County
– Food insecurity rate: 11.0% (168,410 total)
— 0.9% higher than national average
– Child food insecurity rate: 15.7% (57,060 total)
— 7.5% higher than national average
– Annual food budget shortfall: $94,463,000
— Cost per meal: $3.28

LPS.1 // Wikicommons
#30. San Joaquin County
– Food insecurity rate: 11.5% (85,740 total)
— 5.5% higher than national average
– Child food insecurity rate: 16.9% (34,190 total)
— 15.8% higher than national average
– Annual food budget shortfall: $46,879,000
— Cost per meal: $3.20

Canva
#29. Sierra County
– Food insecurity rate: 11.6% (350 total)
— 6.4% higher than national average
– Child food insecurity rate: 17.5% (80 total)
— 19.9% higher than national average
– Annual food budget shortfall: $212,000
— Cost per meal: $3.55

Canva
#28. Calaveras County
– Food insecurity rate: 11.8% (5,360 total)
— 8.3% higher than national average
– Child food insecurity rate: 18.7% (1,460 total)
— 28.1% higher than national average
– Annual food budget shortfall: $4,229,000
— Cost per meal: $4.62

Public Domain
#27. Stanislaus County
– Food insecurity rate: 11.8% (64,300 total)
— 8.3% higher than national average
– Child food insecurity rate: 16.9% (24,970 total)
— 15.8% higher than national average
– Annual food budget shortfall: $35,745,000
— Cost per meal: $3.25
Finetooth // Wikimedia Commons
#26. Lassen County
– Food insecurity rate: 12.3% (3,790 total)
— 12.8% higher than national average
– Child food insecurity rate: 18.9% (870 total)
— 29.5% higher than national average
– Annual food budget shortfall: $2,540,000
— Cost per meal: $3.92

Public Domain
#25. Madera County
– Food insecurity rate: 12.6% (19,620 total)
— 15.6% higher than national average
– Child food insecurity rate: 19.9% (8,530 total)
— 36.3% higher than national average
– Annual food budget shortfall: $12,764,000
— Cost per meal: $3.81

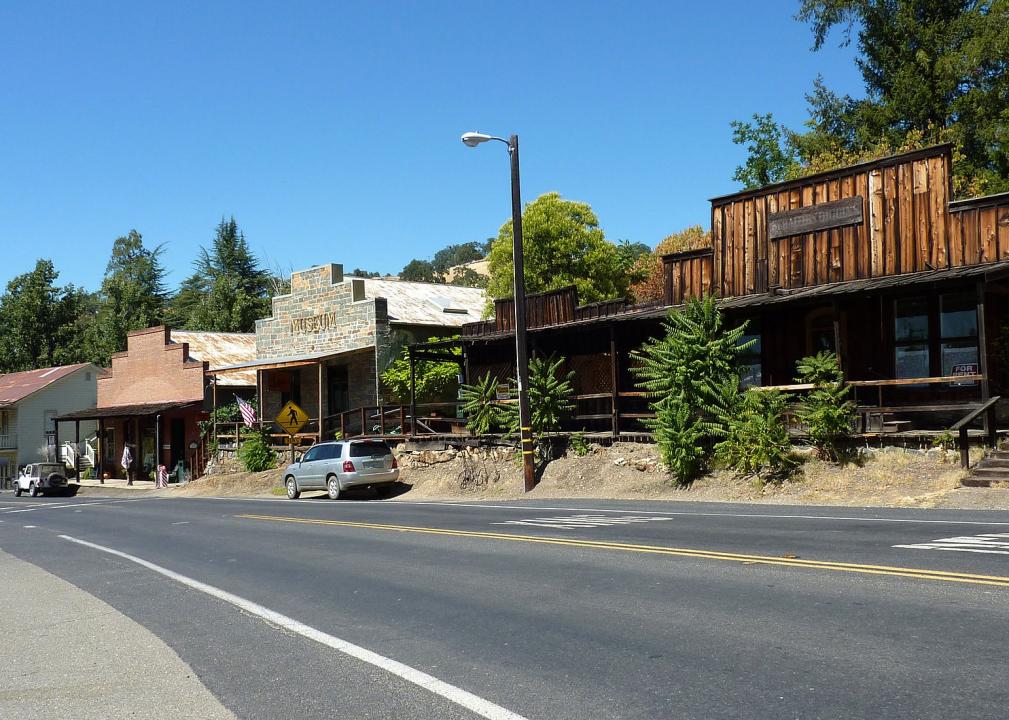
Bobak Ha’Eri // Wikimedia Commons
#24. Tuolumne County
– Food insecurity rate: 12.7% (6,860 total)
— 16.5% higher than national average
– Child food insecurity rate: 16.8% (1,510 total)
— 15.1% higher than national average
– Annual food budget shortfall: $4,684,000
— Cost per meal: $3.99

Susan Popielaski // Wikimedia Commons
#23. Alpine County
– Food insecurity rate: 13.1% (140 total)
— 20.2% higher than national average
– Child food insecurity rate: 19.4% (40 total)
— 32.9% higher than national average
– Annual food budget shortfall: $87,000
— Cost per meal: $3.65

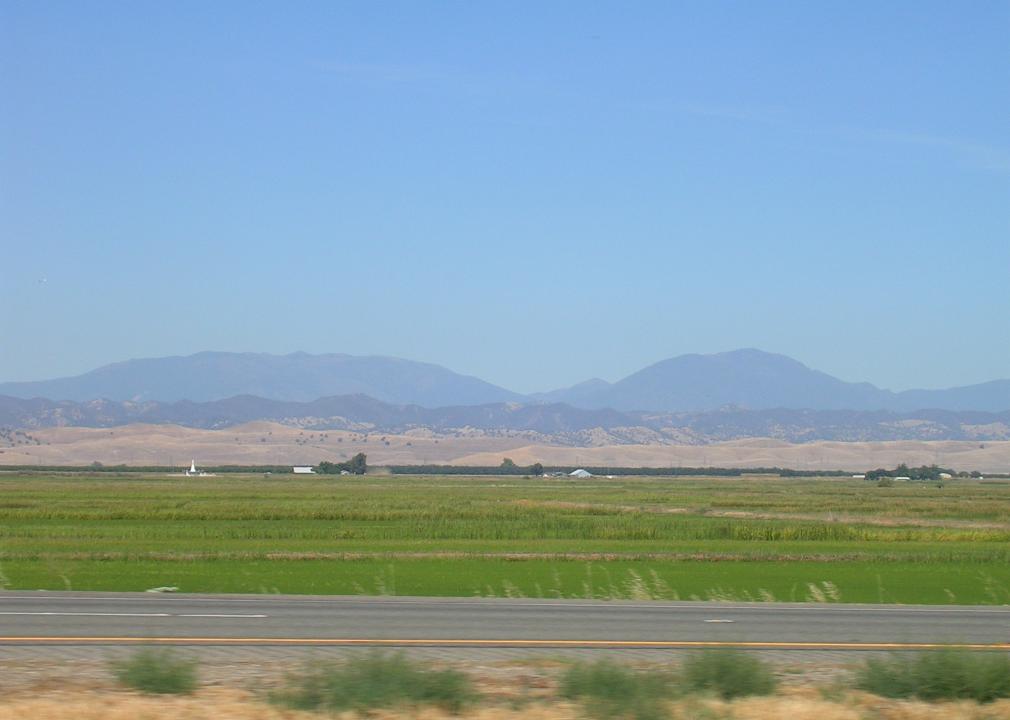
U.S. Army Corps of Engineers Sacramento District // Wikimedia Commons
#22. Yuba County
– Food insecurity rate: 13.2% (10,090 total)
— 21.1% higher than national average
– Child food insecurity rate: 18.2% (3,850 total)
— 24.7% higher than national average
– Annual food budget shortfall: $5,254,000
— Cost per meal: $3.05

Kenneth Green // Wikimedia Commons
#21. Plumas County
– Food insecurity rate: 13.4% (2,500 total)
— 22.9% higher than national average
– Child food insecurity rate: 17.2% (540 total)
— 17.8% higher than national average
– Annual food budget shortfall: $1,465,000
— Cost per meal: $3.43

CleanWater17 // Wikimedia Commons
#20. Colusa County
– Food insecurity rate: 13.4% (2,870 total)
— 22.9% higher than national average
– Child food insecurity rate: 21.9% (1,280 total)
— 50.0% higher than national average
– Annual food budget shortfall: $1,652,000
— Cost per meal: $3.37

Armona // Wikicommons
#19. Kings County
– Food insecurity rate: 13.4% (20,220 total)
— 22.9% higher than national average
– Child food insecurity rate: 20.1% (8,230 total)
— 37.7% higher than national average
– Annual food budget shortfall: $10,398,000
— Cost per meal: $3.01
Trance addict // Wikimedia Commons
#18. Glenn County
– Food insecurity rate: 13.6% (3,790 total)
— 24.8% higher than national average
– Child food insecurity rate: 18.3% (1,370 total)
— 25.3% higher than national average
– Annual food budget shortfall: $2,029,000
— Cost per meal: $3.13

Binksternet // Wikimedia Commons
#17. Mendocino County
– Food insecurity rate: 13.7% (11,950 total)
— 25.7% higher than national average
– Child food insecurity rate: 19.1% (3,580 total)
— 30.8% higher than national average
– Annual food budget shortfall: $7,214,000
— Cost per meal: $3.53
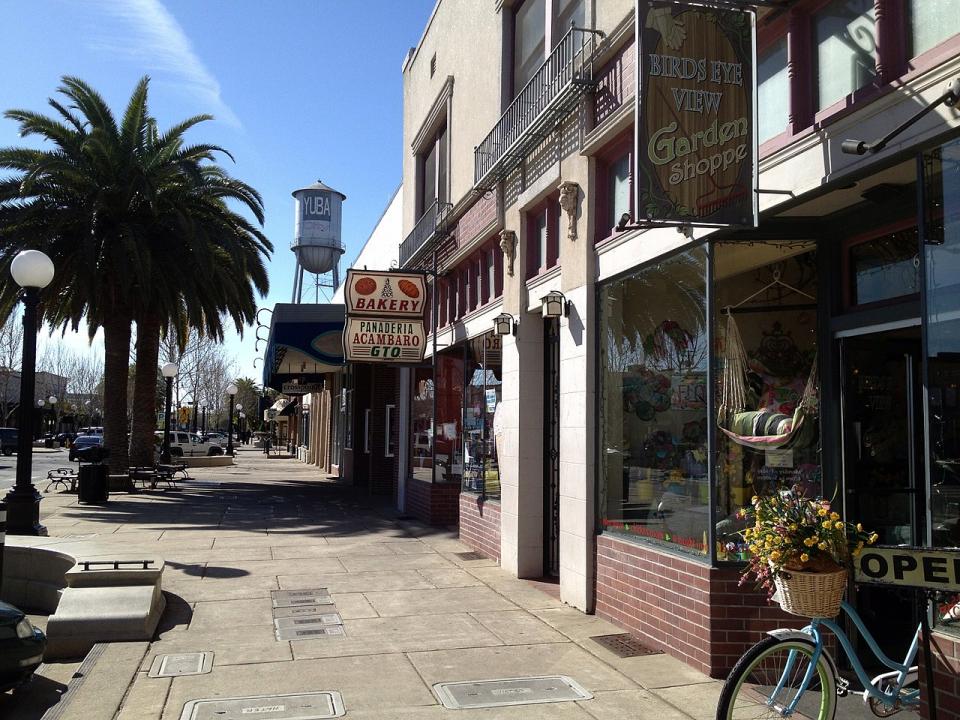
Ray Bouknight // Wikicommons
#16. Sutter County
– Food insecurity rate: 13.7% (13,170 total)
— 25.7% higher than national average
– Child food insecurity rate: 19.7% (4,930 total)
— 34.9% higher than national average
– Annual food budget shortfall: $6,564,000
— Cost per meal: $2.92

nickchapman // Wikicommons
#15. Kern County
– Food insecurity rate: 13.7% (121,800 total)
— 25.7% higher than national average
– Child food insecurity rate: 20.7% (53,350 total)
— 41.8% higher than national average
– Annual food budget shortfall: $62,109,000
— Cost per meal: $2.98

EPoelzl // Wikimedia Commons
#14. Mariposa County
– Food insecurity rate: 14.1% (2,450 total)
— 29.4% higher than national average
– Child food insecurity rate: 22.2% (630 total)
— 52.1% higher than national average
– Annual food budget shortfall: $1,328,000
— Cost per meal: $3.17

Mark Miller // Wikimedia Commons
#13. Merced County
– Food insecurity rate: 14.3% (38,880 total)
— 31.2% higher than national average
– Child food insecurity rate: 21.6% (17,350 total)
— 47.9% higher than national average
– Annual food budget shortfall: $21,242,000
— Cost per meal: $3.20

Canva
#12. Butte County
– Food insecurity rate: 14.4% (32,450 total)
— 32.1% higher than national average
– Child food insecurity rate: 18.7% (8,510 total)
— 28.1% higher than national average
– Annual food budget shortfall: $18,034,000
— Cost per meal: $3.25

Doug Kerr // Wikicommons
#11. Shasta County
– Food insecurity rate: 14.5% (25,910 total)
— 33.0% higher than national average
– Child food insecurity rate: 20.4% (7,900 total)
— 39.7% higher than national average
– Annual food budget shortfall: $14,084,000
— Cost per meal: $3.18

David Jordan // Wikicommons
#10. Fresno County
– Food insecurity rate: 14.7% (144,790 total)
— 34.9% higher than national average
– Child food insecurity rate: 22.0% (61,680 total)
— 50.7% higher than national average
– Annual food budget shortfall: $74,909,000
— Cost per meal: $3.03

Cory Maylett // Wikimedia Commons
#9. Humboldt County
– Food insecurity rate: 14.8% (20,060 total)
— 35.8% higher than national average
– Child food insecurity rate: 18.2% (4,760 total)
— 24.7% higher than national average
– Annual food budget shortfall: $11,318,000
— Cost per meal: $3.30
![]()
CFang // Wikimedia Commons
#8. Lake County
– Food insecurity rate: 15.0% (9,640 total)
— 37.6% higher than national average
– Child food insecurity rate: 20.9% (2,800 total)
— 43.2% higher than national average
– Annual food budget shortfall: $6,557,000
— Cost per meal: $3.98

Scott Burley // Wikimedia Commons
#7. Modoc County
– Food insecurity rate: 15.6% (1,390 total)
— 43.1% higher than national average
– Child food insecurity rate: 22.4% (390 total)
— 53.4% higher than national average
– Annual food budget shortfall: $785,000
— Cost per meal: $3.30

Canva
#6. Tulare County
– Food insecurity rate: 15.6% (71,990 total)
— 43.1% higher than national average
– Child food insecurity rate: 23.0% (32,950 total)
— 57.5% higher than national average
– Annual food budget shortfall: $37,455,000
— Cost per meal: $3.04

Canva
#5. Del Norte County
– Food insecurity rate: 15.8% (4,350 total)
— 45.0% higher than national average
– Child food insecurity rate: 22.8% (1,350 total)
— 56.2% higher than national average
– Annual food budget shortfall: $2,513,000
— Cost per meal: $3.38
Almonroth // Wikimedia Commons
#4. Trinity County
– Food insecurity rate: 15.9% (2,020 total)
— 45.9% higher than national average
– Child food insecurity rate: 24.2% (520 total)
— 65.8% higher than national average
– Annual food budget shortfall: $1,134,000
— Cost per meal: $3.29

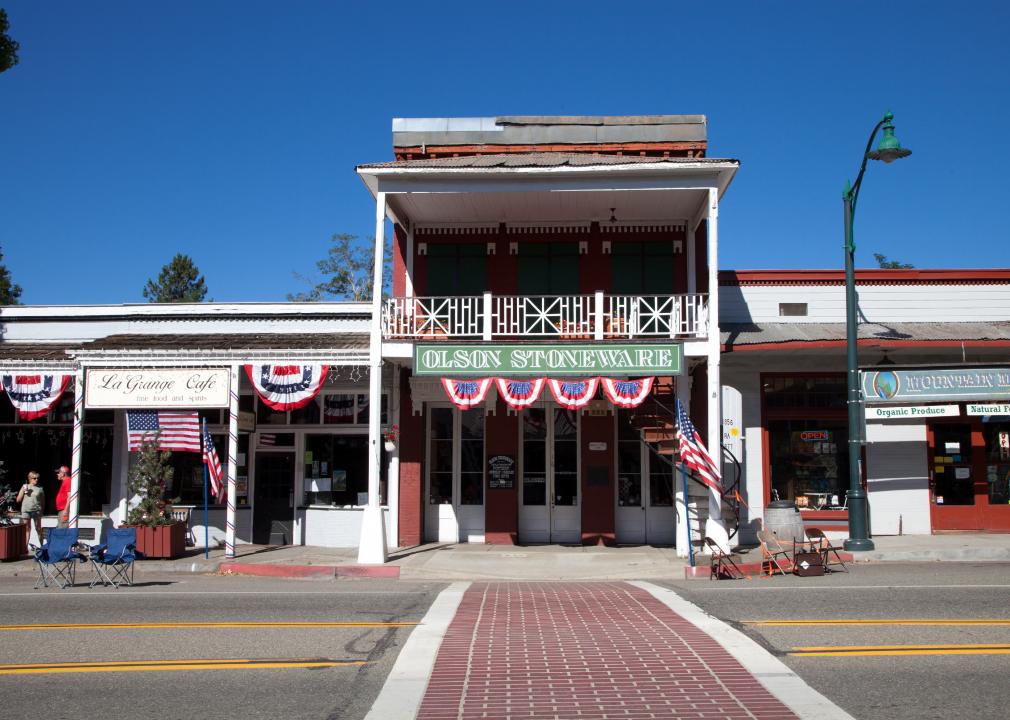
Frank Schulenburg // Wikimedia Commons
#3. Tehama County
– Food insecurity rate: 15.9% (10,170 total)
— 45.9% higher than national average
– Child food insecurity rate: 23.6% (3,600 total)
— 61.6% higher than national average
– Annual food budget shortfall: $5,626,000
— Cost per meal: $3.24

Chmee2 // Wikimedia Commons
#2. Siskiyou County
– Food insecurity rate: 16.2% (7,020 total)
— 48.6% higher than national average
– Child food insecurity rate: 22.5% (1,980 total)
— 54.1% higher than national average
– Annual food budget shortfall: $3,925,000
— Cost per meal: $3.27

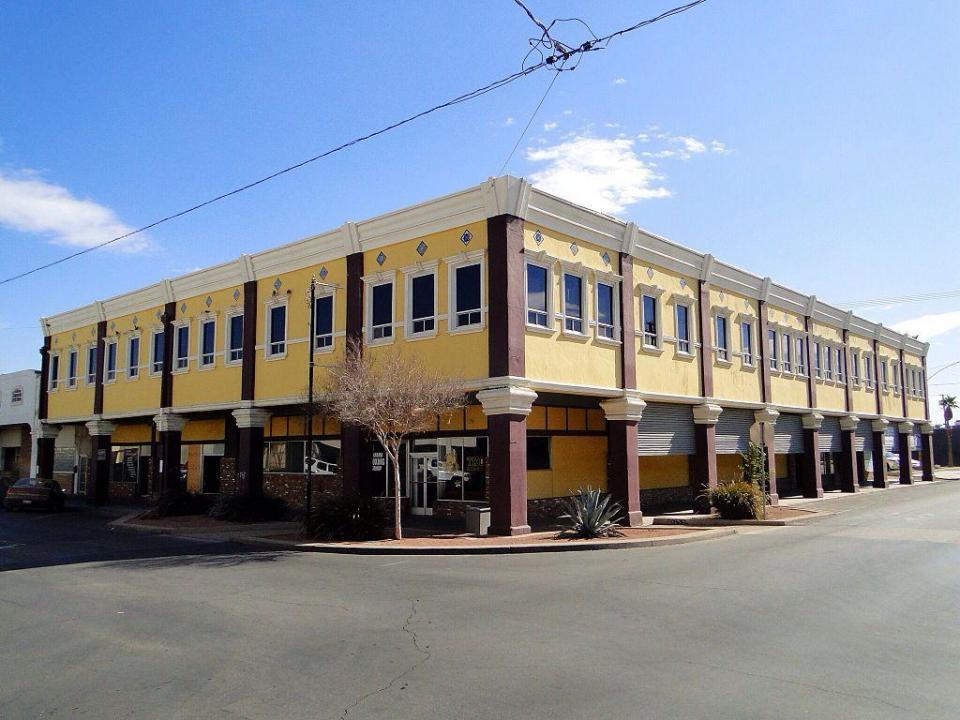
Cbl62 // Wikicommons
#1. Imperial County
– Food insecurity rate: 19.1% (34,580 total)
— 75.2% higher than national average
– Child food insecurity rate: 31.0% (16,060 total)
— 112.3% higher than national average
– Annual food budget shortfall: $16,251,000
— Cost per meal: $2.75